Description
- In this guide, we will build a web server with the Nodemcu to display temperature sensor readings on the analog gauge.
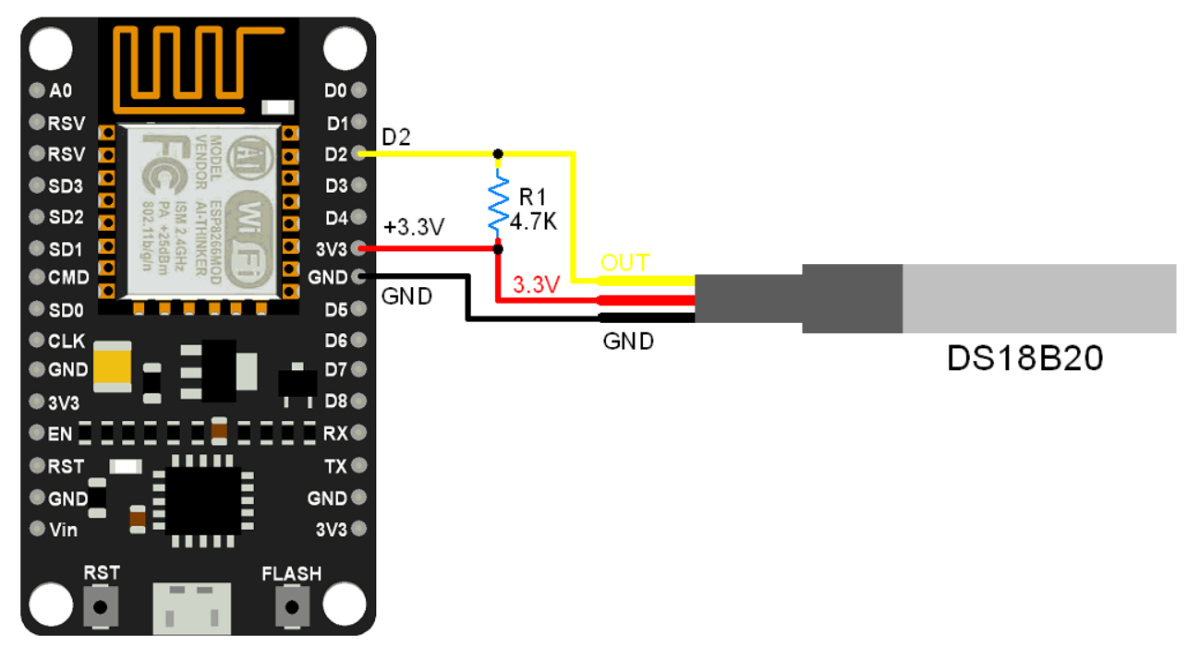
- We will use the DS18B20 temperature sensor as an example. It is a digital temperature sensor that measures temperature in the range of -55°C to 125°C
- To build the web server page we will use HTML, CSS, and Javascript programming languages.
- Here we will use the LittleFS filesystem to save the HTML, CSS, and JavaScript files in a better-organized form and easier to understand.
DS18B20 Interfacing Diagram with Nodemcu
Install required libraries
First download and install the ESPAsyncWebServer library from the below link
https://github.com/me-no-dev/ESPAsyncWebServer
then download and install the AsyncTCP library from the below link
https://github.com/me-no-dev/ESPAsyncTCP
and download and install the Arduino JSON library from the below link
https://github.com/arduino-libraries/Arduino_JSON
Download and extract the above library and add the folder to the libraries folder path of Arduino IDE.
For information about how to add a custom library to the Arduino IDE and use examples from it, refer to Adding Library To Arduino IDE in the Basics section.
Here we are using DallasTemperature libraries for the temperature measurement. We need to install the DallasTemperature library using the Arduino Library Manager.
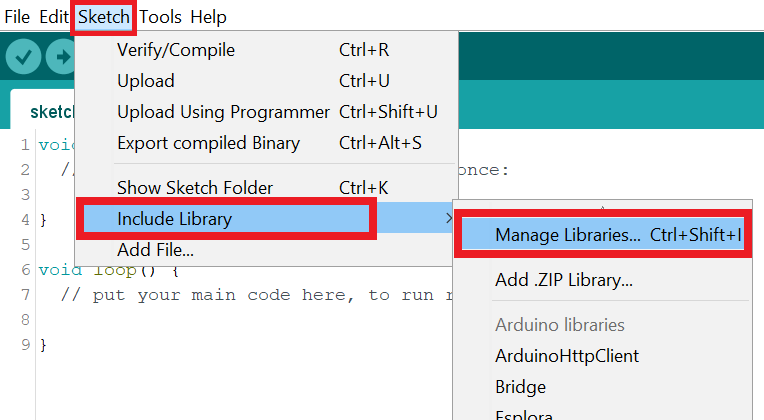
- Open the Arduino IDE
- Navigate to Sketch ► Include Library ► Manage Libraries…
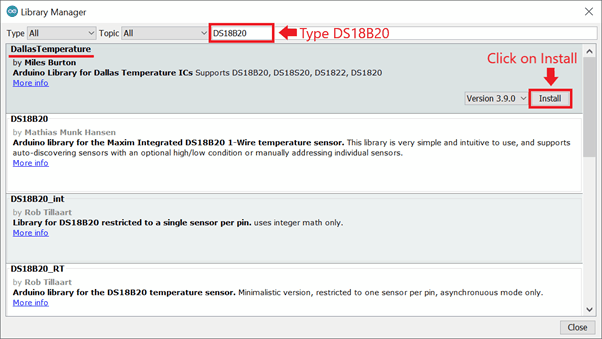
- The library Manager window will pop up. Now enter DS18B20 into the search box, and click Install on the DallasTemperature option to install version 3.9.0 or higher. As shown below image.
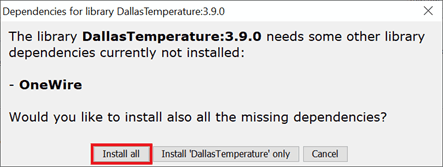
- If you don’t have the OneWire library, then this pop-up will come then click on Install all.
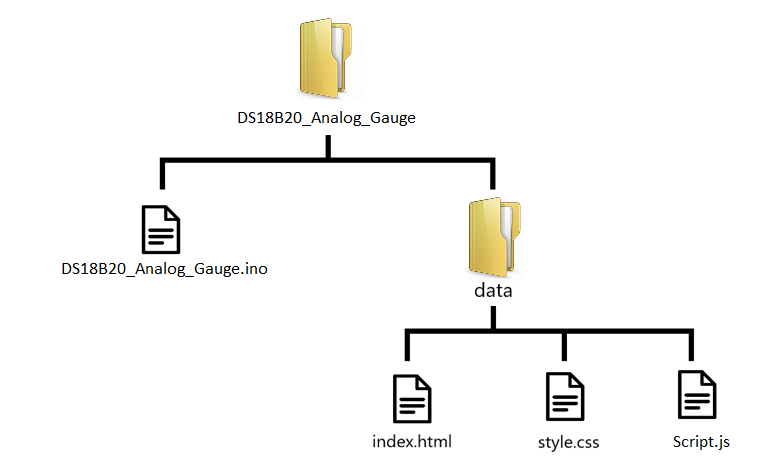
Files Organization
For web server building we need four different files. Arduino sketch, HTML file, CSS file, and javascript file Here we will save the HTML, CSS, and javascript files inside the data folder and Arduino sketch in the Arduino folder, as shown below:
HTML File code
Create a index.html file inside the data folder and paste the below code inside index.html file
<!DOCTYPE html>
<html>
  <head>
    <title>ESP IOT DASHBOARD</title>
    <meta name="viewport" content="width=device-width, initial-scale=1">
    <link rel="icon" type="image/png" href="favicon.png">
    <link rel="stylesheet" href="https://use.fontawesome.com/releases/v5.7.2/css/all.css" integrity="sha384-fnmOCqbTlWIlj8LyTjo7mOUStjsKC4pOpQbqyi7RrhN7udi9RwhKkMHpvLbHG9Sr" crossorigin="anonymous">
    <link rel="stylesheet" type="text/css" href="style.css">
    <script src="http://cdn.rawgit.com/Mikhus/canvas-gauges/gh-pages/download/2.1.7/all/gauge.min.js"></script>
  </head>
  <body>
    <div class="topnav">
      <h1>Nodemcu Temperature Gauge</h1>
    </div>
    <div class="content">
      <div class="card-grid">
        <div class="card">
          <p class="card-title">DS18B20 Temperature gauge</p>
          <canvas id="gauge-temperature"></canvas>
        </div>
      </div>
    </div>
    <script src="script.js"></script>
  </body>
</html>
let’s understand the code
All html pages start with the <!DOCTYPE html> declaration, it is just information to the browser about what type of document is expected.
<!DOCTYPE html>The html tag is the container of the complete html page which represents on the top of the html code.
<html>The below code snippet sets up the viewport for the web page's display. It specifies a favicon, which is the icon displayed in the browser tab.
The CSS file provides access to font and icons properties. The stylesheet links a local CSS file called "style.css" for styling the HTML document.
<meta name="viewport" content="width=device-width, initial-scale=1">
<link rel="icon" type="image/png" href="favicon.png">
<link rel="stylesheet" href="https://use.fontawesome.com/releases/v5.7.2/css/all.css" integrity="sha384-fnmOCqbTlWIlj8LyTjo7mOUStjsKC4pOpQbqyi7RrhN7udi9RwhKkMHpvLbHG9Sr" crossorigin="anonymous">
<link rel="stylesheet" type="text/css" href="style.css">
Here we have added a JavaScript file called "gauge.min.js" from a CDN (Content Delivery Network). This file is used for creating and displaying gauge visualizations. The gauge.min.js file is retrieved from the specified URL and loaded into the web page for use.
<script src="http://cdn.rawgit.com/Mikhus/canvas-gauges/gh-pages/download/2.1.7/all/gauge.min.js"></script>This is the HTML division element with the class name "topnav".
Inside the division, there is a heading level 1 (h1) element displaying the text "Nodemcu Temperature Gauge".
This code is typically used to create a navigation bar or header section on a web page.
<div class="topnav">
   <h1>Nodemcu Temperature Gauge</h1>
</div>
The card contains a paragraph element with the class "card-title" displaying the text "DS18B20 Temperature gauge".
Here is a canvas element with the id "gauge-temperature" used to create a card-based layout for displaying temperature gauge information on a web page.
<div class="content">
   <div class="card-grid">
      <div class="card">
        <p class="card-title">DS18B20 Temperature gauge</p>
          <canvas id="gauge-temperature"></canvas>
      </div>
    </div>
</div>
CSS File code
Create a style.css file inside the data folder and paste the below code inside style.css file
html {
  font-family: Arial, Helvetica, sans-serif;
  display: inline-block;
  text-align: center;
}
h1 {
  font-size: 1.8rem;
  color: white;
}
p {
  font-size: 1.4rem;
}
.topnav {
  overflow: hidden;
  background-color: #ff0000;
}
body {
  margin: 0;
}
.content {
  padding: 5%;
}
.card-grid {
  max-width: 1200px;
  margin: 0 auto;
  display: grid;
  grid-gap: 2rem;
  grid-template-columns: repeat(auto-fit, minmax(200px, 1fr));
}
.card {
  background-color: white;
  box-shadow: 2px 2px 12px 1px rgba(140,140,140,.5);
}
.card-title {
  font-size: 1.2rem;
  font-weight: bold;
  color: #ff0000;
}
Java Script File code
Create a script.js file inside the data folder and paste the below code inside script.js file
window.addEventListener('load', getReadings);

var gaugeTemp = new RadialGauge({
 renderTo: 'gauge-temperature',
  width: 300,
  height: 300,
  units: "Temperature (DegC)",
  minValue: 0,
  maxValue: 100,
  colorValueBoxRect: "#ff0000",
  colorValueBoxRectEnd: "#ff0000",
  colorValueBoxBackground: "#ffffff",
  valueInt: 2,
  majorTicks: [
      "0",
        "10",
      "20",
        "30",
      "40",
        "50",
      "60",
        "70",
      "80",
        "90",
      "100"

  ],
  minorTicks: 4,
  strokeTicks: true,
  highlights: [
      {
          "from": 60,
          "to": 100,
          "color": "#ff0000"
      }
  ],
  colorPlate: "#ababab",
  borderShadowWidth: 0,
  borders: true,
  needleType: "line",
  colorNeedle: "#ff0000",
  colorNeedleEnd: "#ff0000",
  needleWidth: 1,
  needleCircleSize: 4,
  colorNeedleCircleOuter: "#ff0000",
  needleCircleOuter: true,
  needleCircleInner: false,
  animationDuration: 1500,
  animationRule: "linear"
}).draw();


// Function to get current readings on the webpage when it loads for the first time
function getReadings(){
  var xhr = new XMLHttpRequest();
  xhr.onreadystatechange = function() {
    if (this.readyState == 4 && this.status == 200) {
      var myObj = JSON.parse(this.responseText);
      console.log(myObj);
      var temp = myObj.temperature;
      gaugeTemp.value = temp;
    }
  };
  xhr.open("GET", "/readings", true);
  xhr.send();
}

if (!!window.EventSource) {
  var source = new EventSource('/events');

  source.addEventListener('open', function(e) {
    console.log("Events Connected");
  }, false);

  source.addEventListener('error', function(e) {
    if (e.target.readyState != EventSource.OPEN) {
      console.log("Events Disconnected");
    }
  }, false);

  source.addEventListener('message', function(e) {
    console.log("message", e.data);
  }, false);

  source.addEventListener('new_readings', function(e) {
    console.log("new_readings", e.data);
    var myObj = JSON.parse(e.data);
    console.log(myObj);
    gaugeTemp.value = myObj.temperature;
  }, false);
}
let’s understand the code
- The below function initializes a radial gauge using the RadialGauge library to render the element with the ID "gauge-temperature".
- It has a width and height of 300 pixels and displays temperature values in degrees Celsius.
- The gauge has a minimum value of 0 and a maximum value of 100.
- The color of the value box is set to red, with a white background.
- Major ticks are displayed at intervals of 10, ranging from 0 to 100.
- There are 4 minor ticks between each major tick.
- The gauge has a highlighted range from 60 to 100, which is colored in red.
- The color plate is set to a light gray color.
- The needle type is set to a line, colored in red.
- The gauge has animation enabled with a duration of 1500 milliseconds and a linear animation rule.
var gaugeTemp = new RadialGauge({
 renderTo: 'gauge-temperature',
  width: 300,
  height: 300,
  units: "Temperature (DegC)",
  minValue: 0,
  maxValue: 100,
  colorValueBoxRect: "#ff0000",
  colorValueBoxRectEnd: "#ff0000",
  colorValueBoxBackground: "#ffffff",
  valueInt: 2,
  majorTicks: [
      "0",
        "10",
      "20",
        "30",
      "40",
        "50",
      "60",
        "70",
      "80",
        "90",
      "100"

  ],
  minorTicks: 4,
  strokeTicks: true,
  highlights: [
      {
          "from": 60,
          "to": 100,
          "color": "#ff0000"
      }
  ],
  colorPlate: "#ababab",
  borderShadowWidth: 0,
  borders: true,
  needleType: "line",
  colorNeedle: "#ff0000",
  colorNeedleEnd: "#ff0000",
  needleWidth: 1,
  needleCircleSize: 4,
  colorNeedleCircleOuter: "#ff0000",
  needleCircleOuter: true,
  needleCircleInner: false,
  animationDuration: 1500,
  animationRule: "linear"
}).draw();
- The below function
getReadings()retrieves temperature readings from the server. - It creates a new XMLHttpRequest object to send an HTTP GET request to the "
/readings" endpoint. - When the response is received, if the request is successful (status code 200) and the response text is valid JSON, the code parses the JSON response and retrieves the temperature value.
- The temperature value is then assigned to the value property of the
gaugeTempobject, updating the gauge display.
function getReadings(){
  var xhr = new XMLHttpRequest();
  xhr.onreadystatechange = function() {
    if (this.readyState == 4 && this.status == 200) {
      var myObj = JSON.parse(this.responseText);
      console.log(myObj);
      var temp = myObj.temperature;
      gaugeTemp.value = temp;
    }
  };
  xhr.open("GET", "/readings", true);
  xhr.send();
}- The code checks if the browser supports
EventSource, which is a mechanism for receiving server-sent events. If supported, it creates a new EventSource object connected to the "/events" endpoint. - It adds event listeners for different events that can occur during the communication.
- When the 'open' event is triggered, it logs a message indicating that the connection to the server for events is established.
- If the 'error' event occurs and the
readyStateof the event target is notEventSource.OPEN, it logs a message indicating that the connection for events is disconnected. - The 'message' event listener logs the received message data.
- The '
new_readings' event listener is specific to a custom event named 'new_readings'. - When this event is received, it logs the event data, parses it as JSON, and assigns the temperature value to the value property of the
gaugeTempobject, updating the gauge display.
if (!!window.EventSource) {
  var source = new EventSource('/events');

  source.addEventListener('open', function(e) {
    console.log("Events Connected");
  }, false);

  source.addEventListener('error', function(e) {
    if (e.target.readyState != EventSource.OPEN) {
      console.log("Events Disconnected");
    }
  }, false);

  source.addEventListener('message', function(e) {
    console.log("message", e.data);
  }, false);

  source.addEventListener('new_readings', function(e) {
    console.log("new_readings", e.data);
    var myObj = JSON.parse(e.data);
    console.log(myObj);
    gaugeTemp.value = myObj.temperature;
  }, false);
}
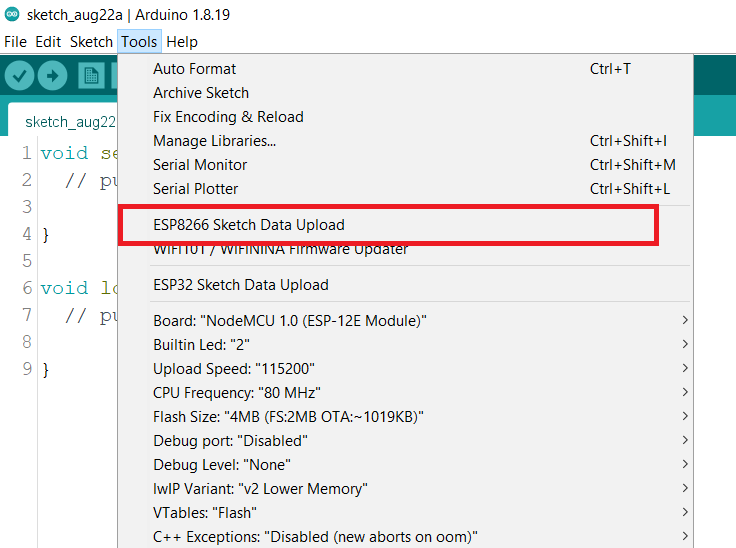
Upload the Files using the Filesystem Uploader
To upload the files, in the Arduino IDE, you just need to go to Tools > ESP8266 Sketch Data Upload.
Now upload the below code
Before uploading the code make sure you have added your SSID, and Password as follows.
const char* ssid = "*Your SSID*";         /*Enter Your SSID*/
const char* password = "*Your Password*"; /*Enter Your Password*/
Analog Gauge code for Nodemcu using Arduino ide
#include <Arduino.h>
#include <ESP8266WiFi.h>
#include <ESPAsyncTCP.h>
#include <ESPAsyncWebServer.h>
#include <Arduino_JSON.h>
#include "LittleFS.h"
#include <OneWire.h>
#include <DallasTemperature.h>

// WiFi credentials
const char* ssid = "SSID";
const char* password = "PASSWORD";

// Initialize the web server on port 80
AsyncWebServer server(80);
// Initialize an event source for server-sent events
AsyncEventSource events("/events");
// JSON variable to hold sensor readings
JSONVar readings;

// Define the OneWire bus pin
#define ONE_WIRE_BUS D2
// Initialize OneWire and DallasTemperature instances
OneWire oneWire(ONE_WIRE_BUS);
DallasTemperature sensors(&oneWire);

unsigned long lastTime = 0;
unsigned long timerDelay = 10000; // Timer interval for sending sensor readings

// Function to obtain sensor readings and return as a JSON string
String getSensorReadings(){
  sensors.requestTemperatures();
  readings["temperature"] = String(sensors.getTempCByIndex(0));
  String jsonString = JSON.stringify(readings);
  return jsonString;
}

// Initialize the LittleFS file system
void initLittleFS() {
  if (!LittleFS.begin()) {
    Serial.println("An error has occurred while mounting LittleFS");
  }
  Serial.println("LittleFS mounted successfully");
}

// Connect to WiFi network
void initWiFi() {
  WiFi.mode(WIFI_STA);
  WiFi.begin(ssid, password);
  Serial.print("Connecting to WiFi ..");
  while (WiFi.status() != WL_CONNECTED) {
    Serial.print('.');
    delay(1000);
  }
  Serial.println(WiFi.localIP());
}

void setup() {
  Serial.begin(115200);

  // Set D2 pin as input with pull-up resistor
  pinMode(D2, INPUT_PULLUP);

  // Initialize WiFi connection
  initWiFi();

  // Initialize LittleFS file system
  initLittleFS();

  // Handle root request
  server.on("/", HTTP_GET, [](AsyncWebServerRequest *request){
    request->send(LittleFS, "/index.html", "text/html");
  });

  // Serve static files
  server.serveStatic("/", LittleFS, "/");

  // Handle readings request
  server.on("/readings", HTTP_GET, [](AsyncWebServerRequest *request){
    String json = getSensorReadings();
    request->send(200, "application/json", json);
    json = String();
  });

  // Handle event source connection
  events.onConnect([](AsyncEventSourceClient *client){
    if(client->lastId()){
      Serial.printf("Client reconnected! Last message ID that it got is: %u\n", client->lastId());
    }
    client->send("hello!", NULL, millis(), 10000);
  });

  // Add event source to the server
  server.addHandler(&events);

  // Initialize DallasTemperature sensors
  sensors.begin();

  // Start the server
  server.begin();
}

void loop() {
  // Send server-sent event and sensor readings at specified intervals
  if ((millis() - lastTime) > timerDelay) {
    events.send("ping", NULL, millis());
    events.send(getSensorReadings().c_str(), "new_readings", millis());
    lastTime = millis();
  }
}- Now upload the code.
- After uploading the code open the serial monitor and set the baud rate to 115200 then reset the nodemcu board and check the IP address as shown in the below image
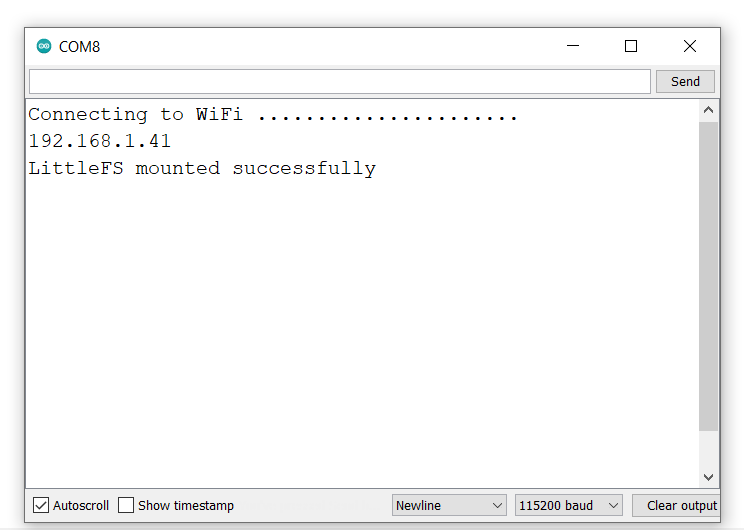
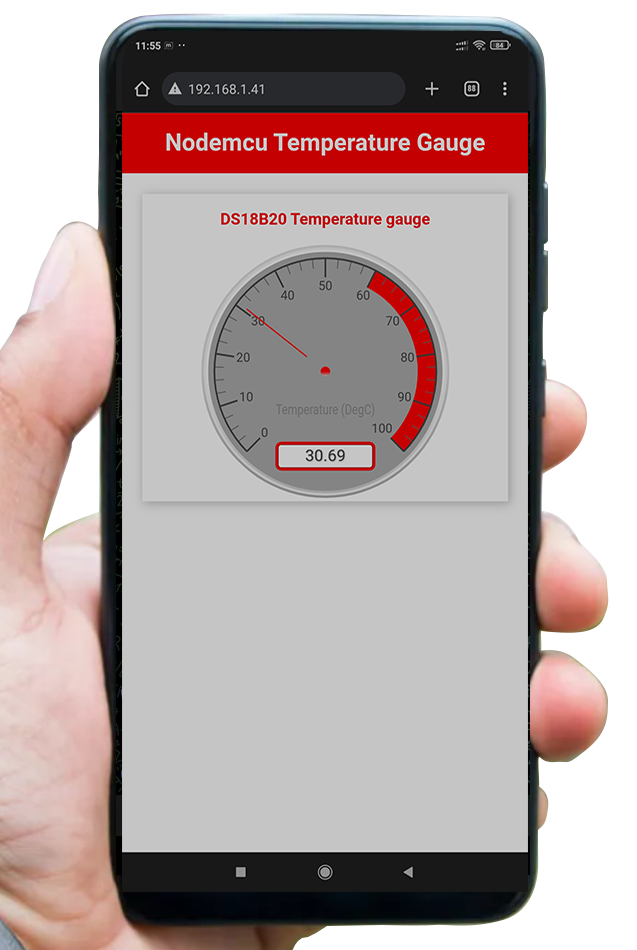
- Now open any mobile browser type the IP address which is shown in the serial monitor and hit the enter button.
- If all is okay, then the web page will start the showing current temperature on the web server like in the below image.
Note: make sure your Nodemcu and mobile are connected to the same router/server, if they are connected to the same router or server then only you will be able to visible the web page.
let’s understand the code
Add the necessary libraries:
#include <Arduino.h>
#include <ESP8266WiFi.h>
#include <ESPAsyncTCP.h>
#include <ESPAsyncWebServer.h>
#include <Arduino_JSON.h>
#include "LittleFS.h"
#include <OneWire.h>
#include <DallasTemperature.h>
set your Wi-Fi network credentials below:
const char* ssid = " SSID";
const char* password = " PASSWORD";
Set the pin number D2 for DS1307 of Nodemcu
#define ONE_WIRE_BUS D2Setup a oneWire instance to communicate with any OneWire devices
OneWire oneWire(ONE_WIRE_BUS);Pass oneWire reference to DallasTemperature.
DallasTemperature sensors(&oneWire);The below code function sets the WiFi as an STA mode and connects to the given SSID and password after successfully connecting to the server print the local IP address on the serial window.
void initWiFi() {
  WiFi.mode(WIFI_STA);
  WiFi.begin(ssid, password);
  Serial.print("Connecting to WiFi ..");
  while (WiFi.status() != WL_CONNECTED) {
    Serial.print('.');
    delay(1000);
  }
  Serial.println(WiFi.localIP());
}
The getSensorReadings() function gets the temperature sensor reading and saves it on the readings JSON array.
String getSensorReadings(){
  sensors.requestTemperatures();
  readings["temperature"] = String(sensors.getTempCByIndex(0));
  String jsonString = JSON.stringify(readings);
  return jsonString;
}
When you visit the IP address of the Nodemcu on the main / URL, the content of the index.html file is sent to create the web page. Additionally, any other requested static files such as style.css and script.js are served to the client.
server.on("/", HTTP_GET, [](AsyncWebServerRequest *request){
 request->send(SPIFFS, "/index.html", "text/html");
});
server.serveStatic("/", SPIFFS, "/");
Now send a JSON string with the updated temperature reading when the request is received on the /readings URL.
server.on("/readings", HTTP_GET, [](AsyncWebServerRequest *request){
 String json = getSensorReadings();
 request->send(200, "application/json", json);
 json = String();
});
Finally, start the server.
server.begin();
Inside loop function,
In the loop function, send events to the browser every 10 seconds with the latest sensor readings to update the web page.
events.send("ping",NULL,millis());
events.send(getSensorReadings().c_str(),"new_readings" ,millis());
events.send("ping",NULL,millis());
Components Used |
||
|---|---|---|
| NodeMCU NodeMCUNodeMCU |
X 1 | |
| DS18B20 Waterproof temperature sensor DS18B20 Waterproof temperature sensor |
X 1 | |
Downloads |
||
|---|---|---|
|
|
Noddemcu_analog_gauge | Download |