Jal Rakshak: Real-Time Municipal Water Purity & Leakage Network . Preventing the next Bhagirathpura tragedy by equipping the Indore Municipal Corporation (IMC) with early-warning pipeline intelligence.
Components Used
Mentioned In Jal Rakshak Part 1 All the componenets used for Jal Rakshak Project are mentioned in Jal Rakshak Project Part 1
X 1
Description
PART 2 Document for Project Jal Rakshak
In part 1 on Jal Rakshak project we left at the point where we made the Edge AI from Edge Impulse platform now will use the exported library in Arduino IDE.
Step 2: Arduino IDE Setup for pipe nodes
Before flashing the node, the Arduino development environment must be loaded with the proper hardware core architectures and communication dependencies.
ESP32 Core Installation: In the Arduino IDE go to board manager , install the 3.2.1 stable esp32 package.
Importing the Edge AI Brain: Navigate to Sketch then Include Library then Add .ZIP Library and select the custom library zip file downloaded from Edge Impulse Studio.
Peripheral Library Dependencies: Install the following open-source libraries via the Library Manager to interface with the rest of the node's sensor hardware:
LoRa (By Sandeep Mistry) – For low-level SX1278 transceiver configuration.
OneWire & DallasTemperature – For managing the digital DS18B20 temperature probe.
Now that everything is configured, it’s time to flash the Node firmware to the ESP32 pipe node
Step 3: Upload Code and Code Logic for pipe nodes
Hardware is only as effective as the firmware driving it. To prevent blind spots in the municipal distribution network, the Pipe Node firmware is engineered around a high-efficiency FreeRTOS dual-core architecture. Instead of a simple, blocking loop, the ESP32-S3 divides its processing power: one core is dedicated entirely to running the Edge AI acoustic model, while the other manages environmental sensors and LoRa telemetry.
1. Pre-Requisite: Node Geographical Configuration
Before clicking "Upload" in the Arduino IDE, it is critical to configure the node's unique identity and geographical location. Because the Master Gateway and the IMC Web Portal need to map where a leak is happening, you must update the NODE_ID, NODE_LATITUDE, and NODE_LONGITUDE variables at the top of the sketch to reflect the node's exact installation coordinates from Google Maps.
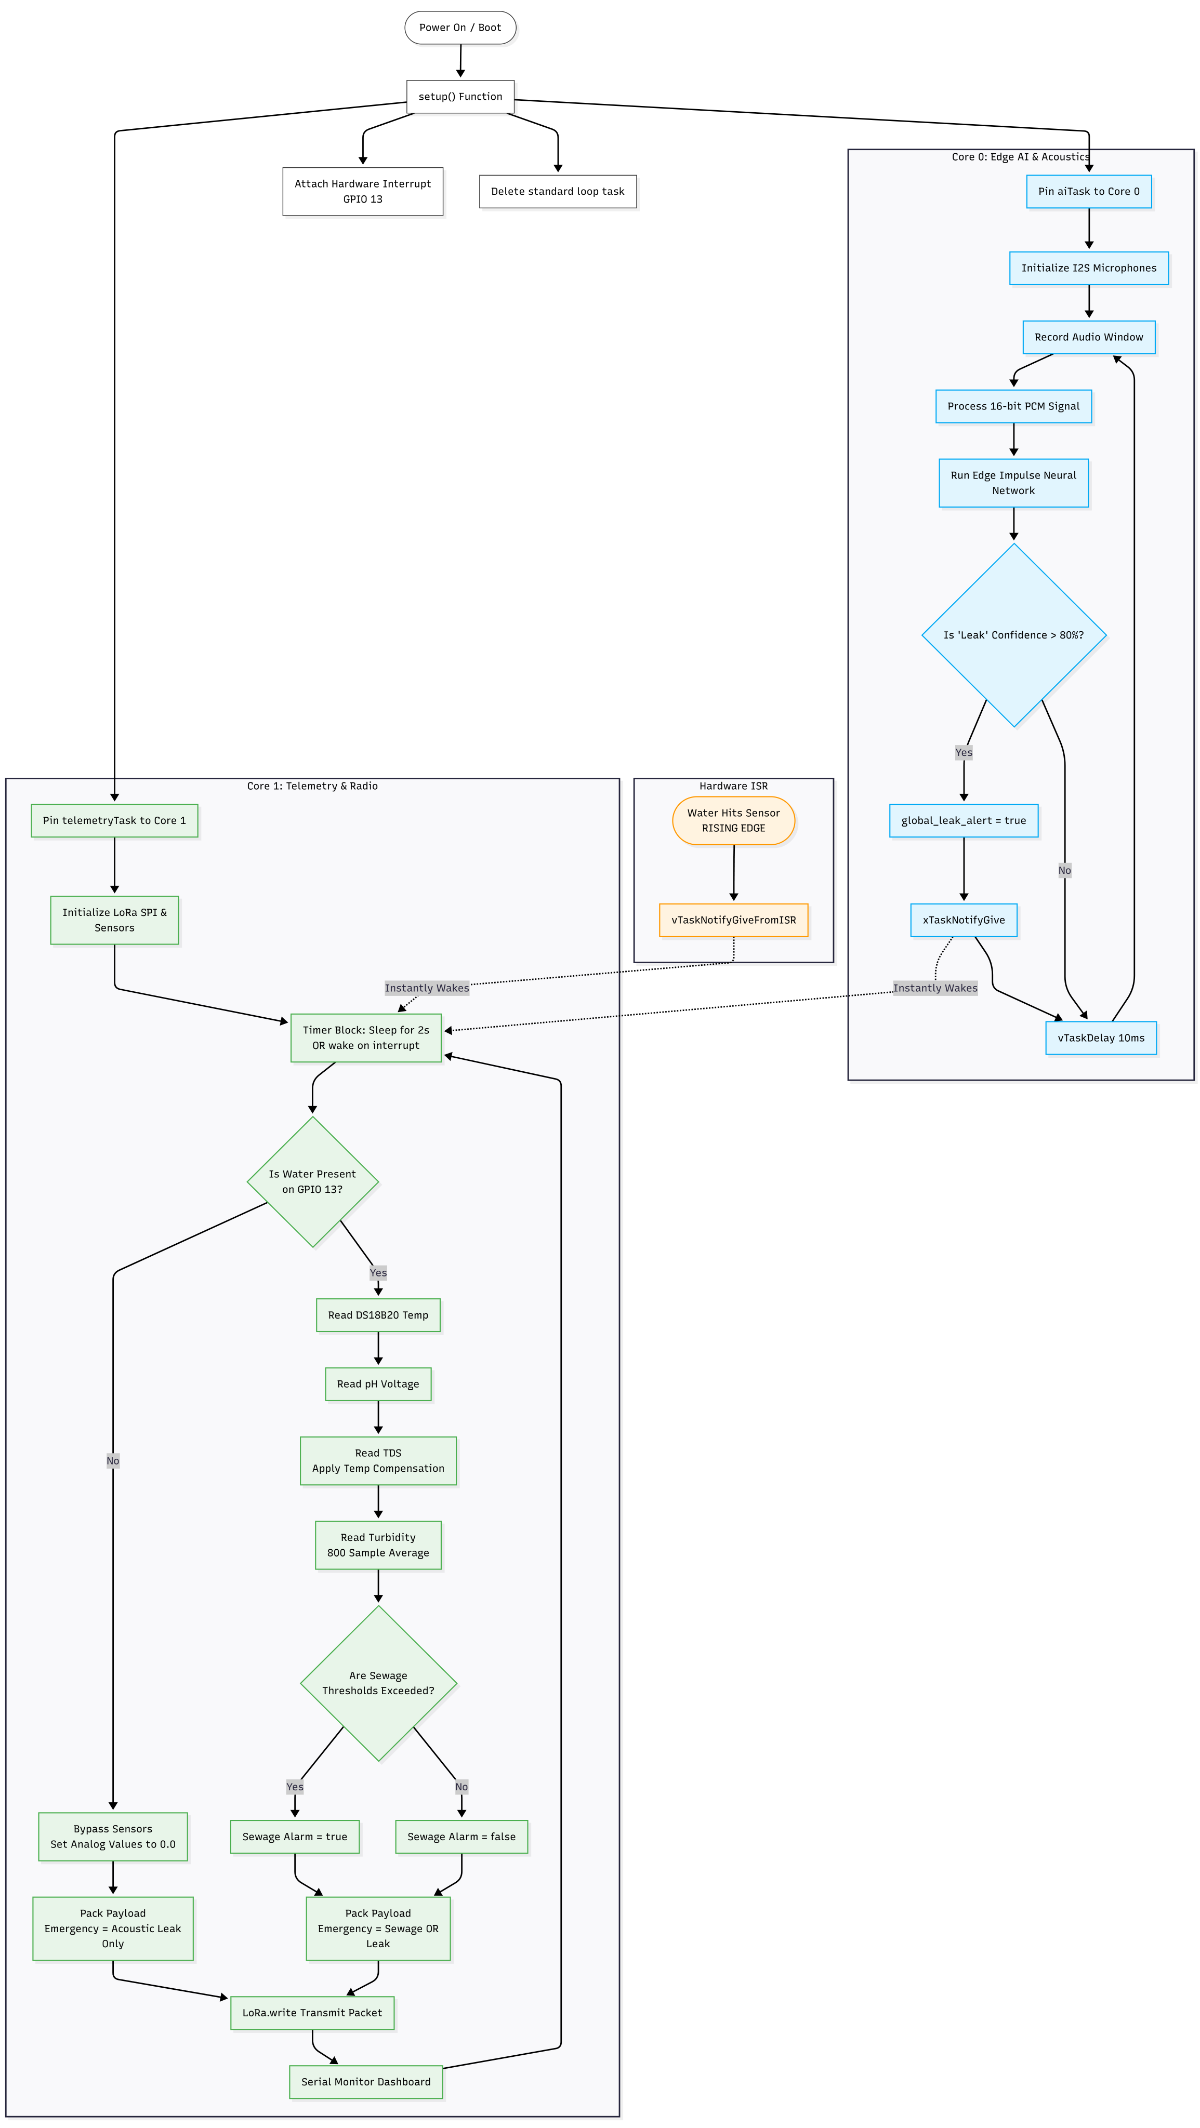
2. Understanding the Core Logic (Flowchart Breakdown)
The firmware is built to be autonomous and resilient. By splitting tasks across the ESP32's two cores, the node never misses an audio anomaly while processing heavy telemetry data.
Based on the flowchart, here is how the system operates in real-time:
Boot & Task Initialization: Upon boot, the setup() function completely deletes the standard Arduino loop. Instead, it pins our heavy Edge AI task to Core 0 and our Telemetry/Radio task to Core 1.
Core 0: The Acoustic Sentinel: This core loops infinitely, filling a buffer with I2S microphone data and running the neural network. If the model detects the acoustic signature of a leak with greater than 80% confidence, it flags global_leak_alert = true and uses xTaskNotifyGive to instantly wake up the telemetry core.
if (result.classification[ix].value > 0.80) { // 80% Confidence Threshold
    leak_detected = true;
}
if (leak_detected && !global_leak_alert) {
    global_leak_alert = true;
    // Instantly wake Core 1 to transmit emergency payload
    xTaskNotifyGive(telemetryTaskHandle);
}
Hardware Interrupts (The Instigator): We don't waste battery polling for water. A hardware interrupt is attached to the water presence sensor (GPIO 13). The moment water hits the pipe, the ISR triggers and instantly wakes Core 1.
Core 1: Smart Telemetry & Dry Pipe Logic: Core 1 sleeps and waits for a 2-second timer, the AI alert, or the water interrupt to wake it up. Once awake, it checks for water presence.
If the pipe is DRY: It bypasses the analog sensors (setting them to 0.0). This is a crucial feature for intermittent municipal supplies—it prevents the node from sending terrifying "Zero pH" false alarms when a pipe is simply empty.
If water is PRESENT: It polls the DS18B20 Temp, pH, TDS, and Turbidity sensors. It evaluates these readings against the WHO safety limits.
Transmission: Regardless of the path, the payload is packed and transmitted via the LoRa module to the Master Gateway, after which the node loops back to sleep.
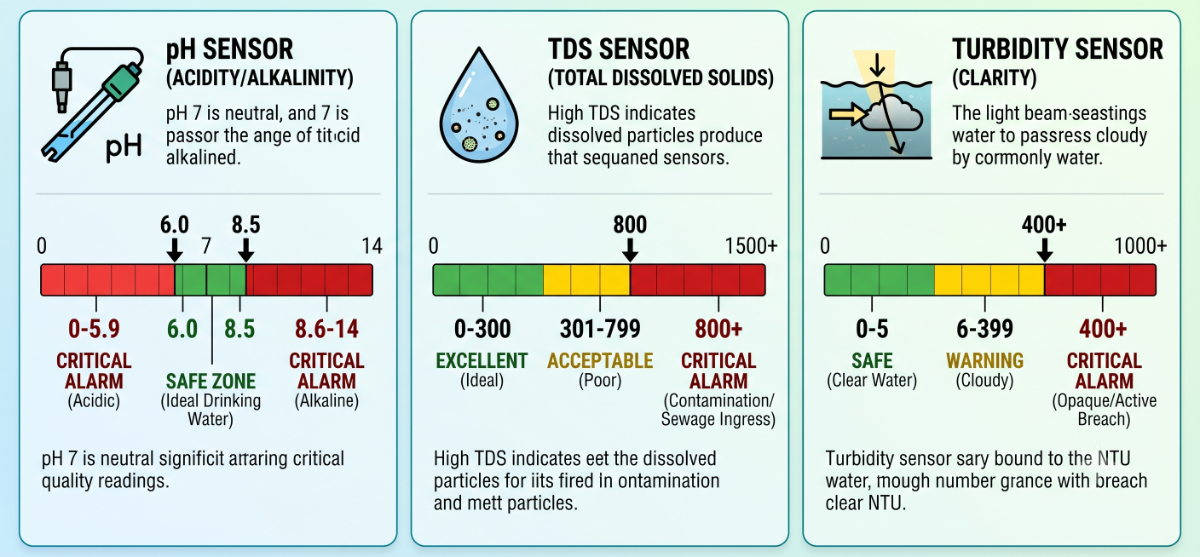
3. Sensor Calibration & Safety Thresholds
To ensure the system accurately identifies catastrophic events like the Bhagirathpura tragedy, the emergency trigger variables programmed into the code are strictly aligned with World Health Organization (WHO) drinking water guidelines.
Understanding these coded thresholds is critical for validating the system's effectiveness:
pH Sensor (Acidity/Alkalinity)
Alarm Threshold:< 6.0 OR > 8.5.
Logic: Pure drinking water should sit perfectly neutral around 7.0. A sudden drop below 6.0 indicates highly acidic, corrosive water, while a spike above 8.5 indicates severe alkalinity. Both extremes trigger an immediate critical alarm.
TDS Sensor (Total Dissolved Solids)
Alarm Threshold:800.0+ ppm.
Logic: Excellent drinking water ranges between 50 to 300 ppm. A sudden spike crossing the 800 ppm threshold is a massive red flag, strongly indicating that raw sewage, soil, or heavy contaminants have breached the pipeline infrastructure.
Turbidity Sensor (Water Clarity)
Alarm Threshold:400.0+ NTU.
Logic: Safe drinking water is virtually clear, reading below 5 NTU. An extreme reading of 400+ NTU means the water is entirely opaque and muddy, physically confirming a catastrophic breach where outside elements are actively mixing into the distribution line.
Then upload the code via Arduino IDE selecting the ESP32 Dev Board and respective comp port. detailed code is present in git hub repository under pipenode - code folder.
Code File is available at github repository : Link
5. Building the Master Gateway
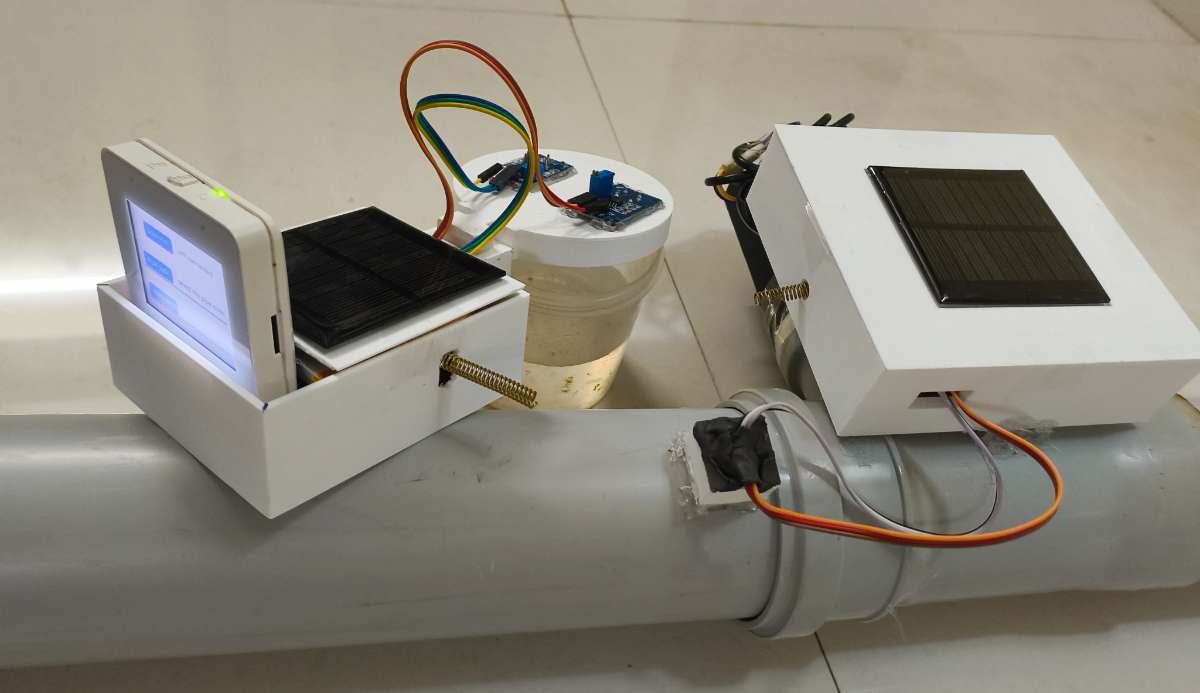
The Master Gateway serves as the centralized brain of the Jal Rakshak system. It is designed to bridge the gap between subterranean edge hardware and municipal decision-makers. Operating above ground, the gateway continuously listens for incoming emergency packets from underground Pipe Nodes over LoRa, coordinates local biochemical validation via an integrated Water Testing Cup, and streams live infrastructure metrics to the cloud via Wi-Fi.
Part A: Hardware Fabrication & Assembly
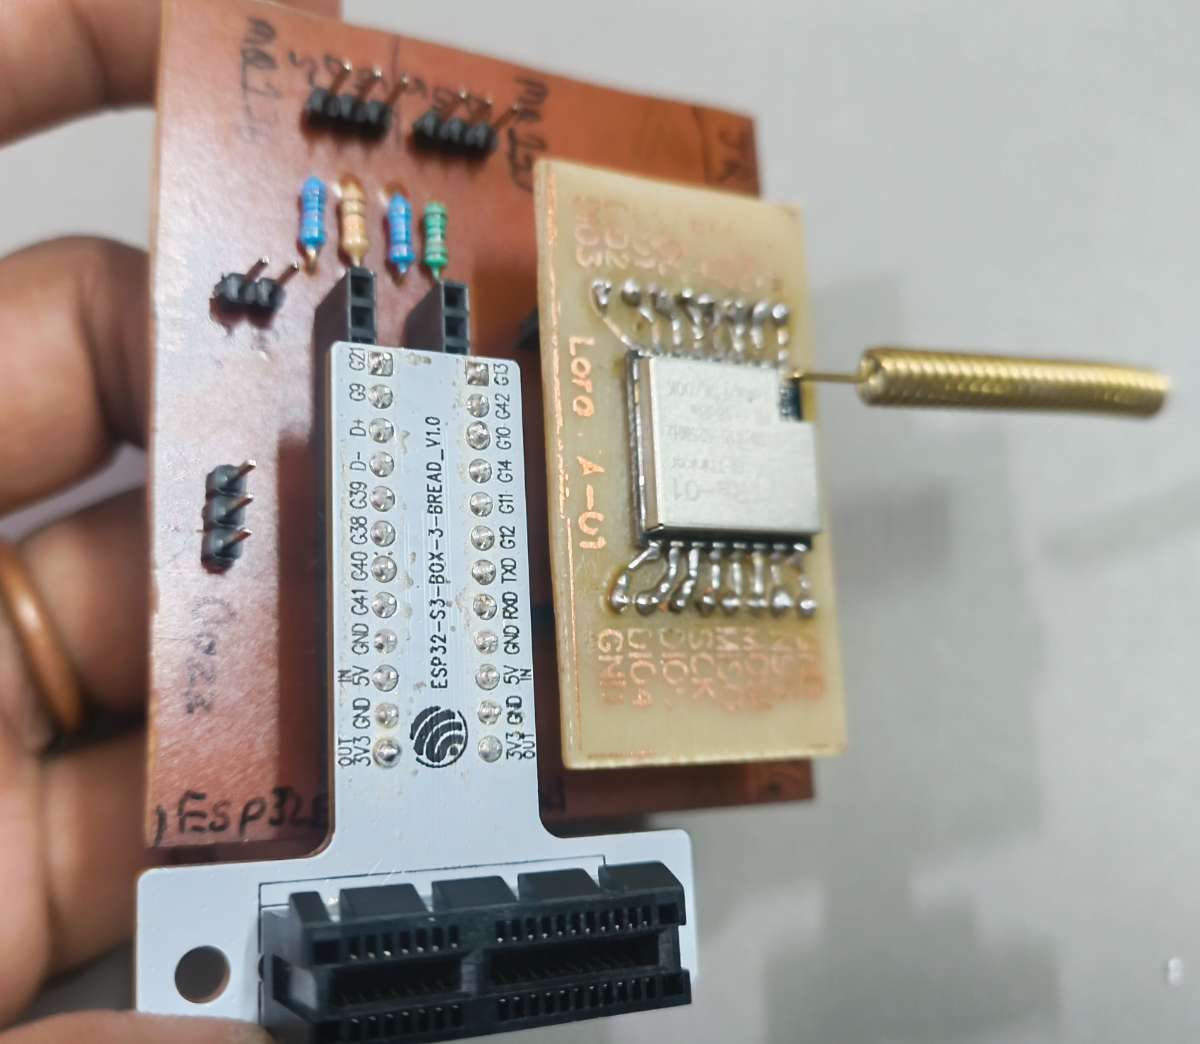
Step 1: PCB Design
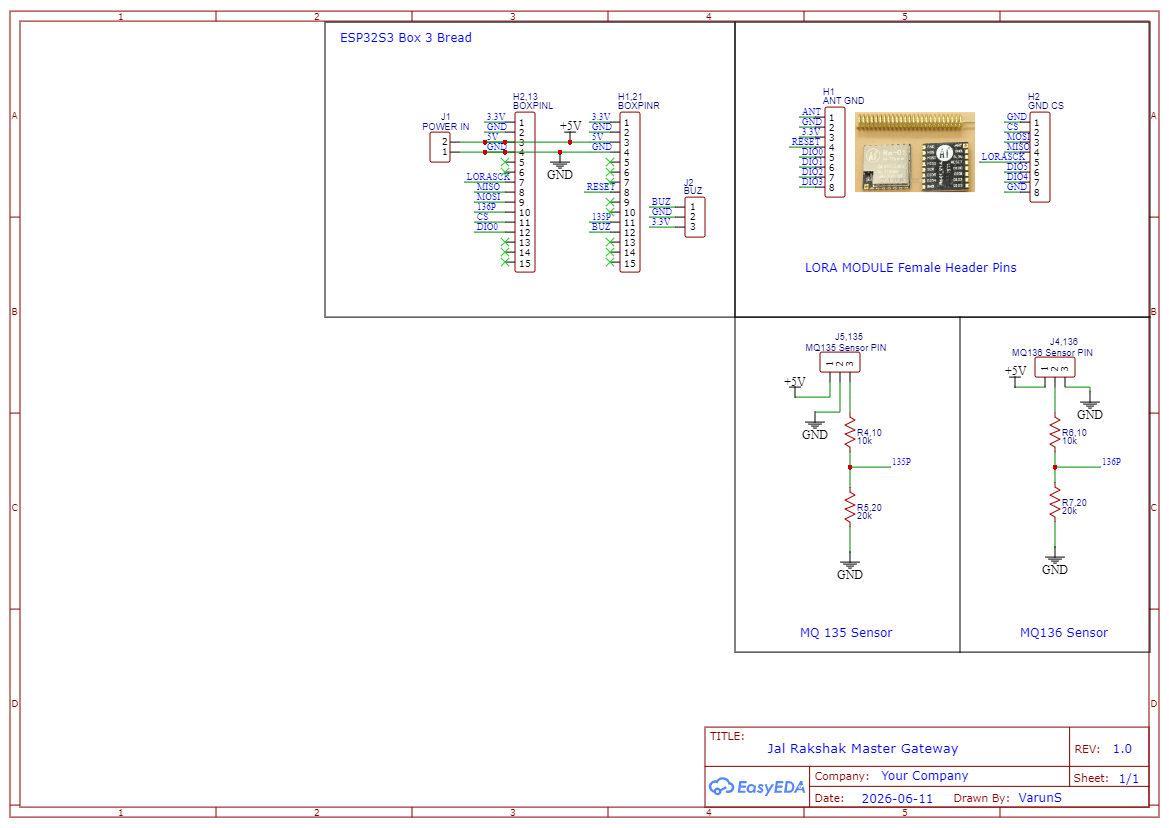
While the underground Pipe Nodes act as our frontline sensory network, the Master Gateway is the centralized nerve center of the entire Jal Rakshak architecture. The schematic for this hub was custom-engineered to manage simultaneous high-speed operations: processing incoming LoRa sub-surface packets, driving a local cloud uplink via Wi-Fi, handling a physical buzzer alarm mechanism, and executing localized biochemical validation via an integrated Water Testing Cup.
A critical engineering challenge handled on this board is the coexistence of mismatched logic levels and the protection of the high-performance ESP32-S3 microcontroller.
The Engineering Challenges & Circuit Solutions
Logic Level Protection for Gas Sensors: To specifically identify sewage ingress—the root cause of the tragic contamination events in our city—the gateway utilizes an MQ135 (Ammonia) and an MQ136 (Hydrogen Sulfide H2S) electrochemical gas sensor array mounted on the testing cup. These industrial sensors require a 5V working voltage to heat their internal elements and produce an accurate analog output curve. Because the ESP32-S3 GPIO pins operate strictly at a maximum of 3.3V, routing the raw 5V sensor outputs directly to the chip would destroy the silicon.
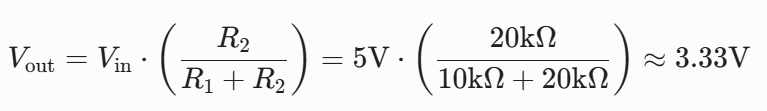
To resolve this without introducing active level-shifter noise, I implemented a passive, high-precision voltage divider network for each sensor channel using a 10k R1 and 20k R2 resistor configuration. This scales the peak 0–5V output down to a safe 0–3.33V matching the microcontroller’s exact Analog-to-Digital Converter (ADC) input range:
Native 3.3V Rail Optimization: The high-frequency Ra-01 LoRa module and the audio warning buzzer operate natively on the 3.3V rail, allowing them to communicate directly with the ESP32-S3 SPI and digital GPIO lines with zero propagation delay.
Power Distribution Subsystem: The entire system is driven by an external 5V Step-Up Charger Module. This stable 5V input feeds the MQ sensor heaters directly, while simultaneously supplying power to the ESP32-S3 development board's internal low-dropout (LDO) regulator to create a clean, uncorrupted 3.3V rail for the RF communication logic.
Master Gateway Hardware Pin Configuration Matrix
To ensure clean, noise-isolated trace routing on the PCB layout, the ESP32-S3 pins were strictly assigned and mapped to the respective peripheral headers as follows:
Component / Module
Function
ESP32-S3 Pin
Operating Voltage
Interface Type / Technical Notes
LoRa Module (Ra-01)
SCK
12
3.3V
High-Speed SPI Clock
MISO
11
3.3V
Master In Slave Out
MOSI
14
3.3V
Master Out Slave In
CS / NSS
42
3.3V
Chip Select
RST
39
3.3V
Hardware Reset Pin
DIO0
13
3.3V
Packet Rx/Tx Hardware Interrupt
Water Testing Cup Suite
MQ135 (Ammonia)
9
5V to 3.3V
ADC1_CH8 via 10k and 20k Divider (Pin 135)
MQ136 (H2S)
10
5V to 3.3V
ADC1_CH9 via 10k and 20k Divider (Pin 136)
Audio Alert System
Active Buzzer
21
3.3V
Digital Output (Local Audio Alarm)
Power Input
Main VCC / GND
5V in
5V
Fed from 5V Step-Up Charger Module
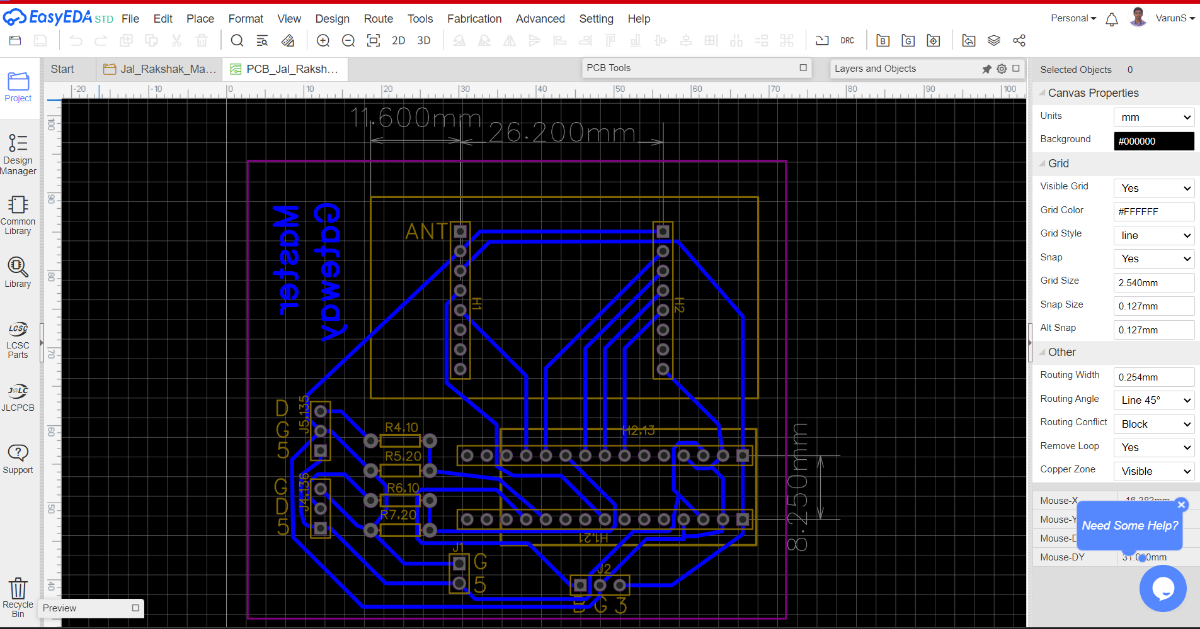
Here is the designed PCB for Master Gateway
Files for PCB design in available in git hub repository : Link
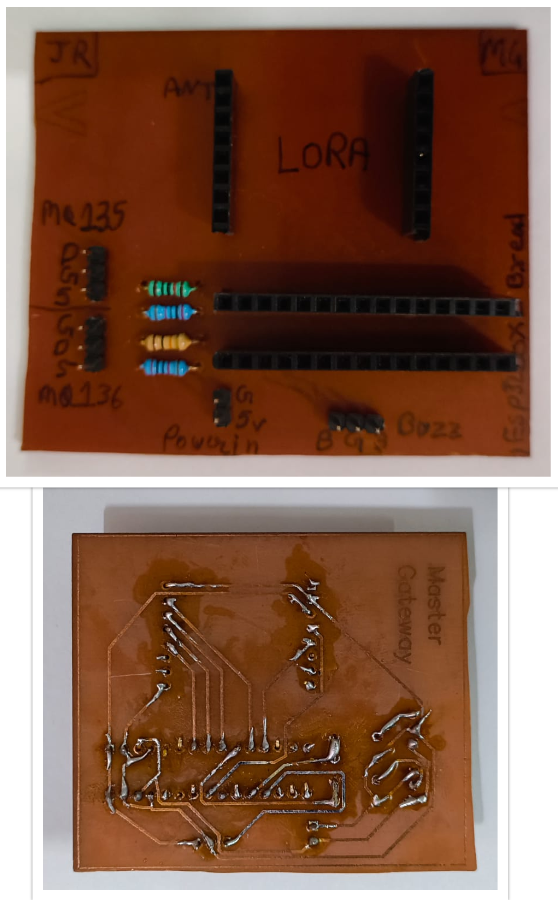
Step 2: PCB Fabrication & Assembly
Because the Master Gateway shares the same rugged hardware standards as our Pipe Nodes, the board was fabricated using the identical in-house toner-transfer and Ferric Chloride (FeCl3) chemical etching process. Replicating this workflow ensured consistency in trace thickness and manufacturing quality across the entire Jal Rakshak ecosystem.
Here i made PCB for Master Gateway with the same steps as given in pipe node step 2 section.
Step 3: CAD Design and 3D Printing
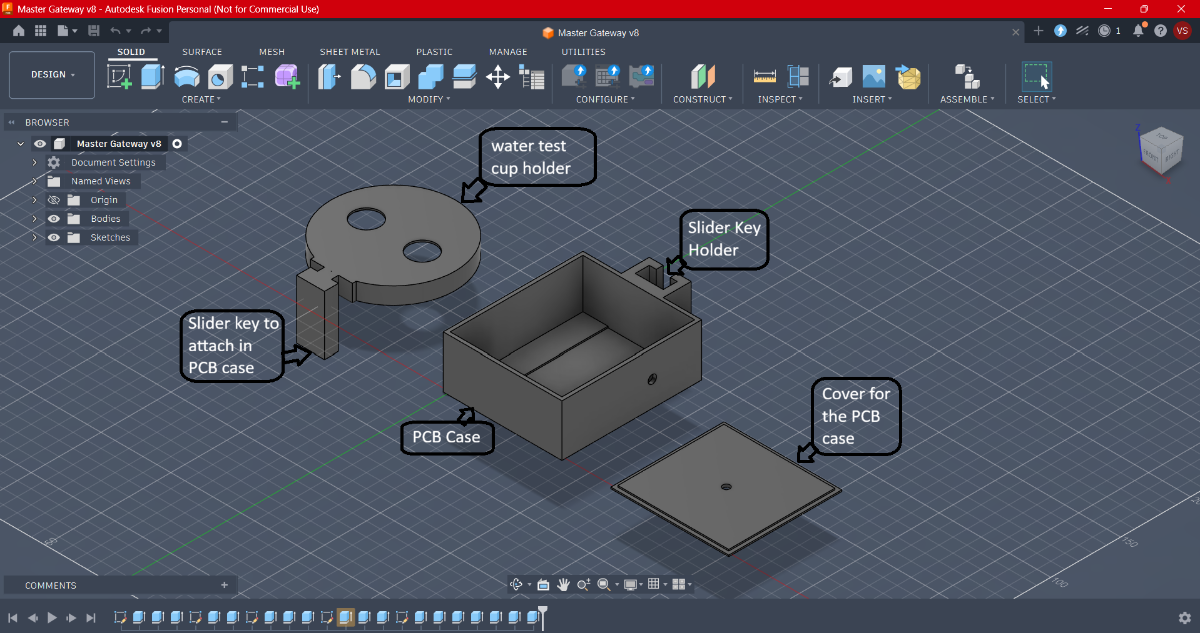
I designed a specialized three-part interlocking enclosure using Autodesk Fusion 360. The primary innovation in this design is a completely hardware-free mechanical docking system that bridges our electronics housing directly with the chemical fluid-testing components.
1. The Three-Part Enclosure Architecture
The gateway housing is broken down into three distinct functional components, each optimized for its specific role in the system:
Part 1: The Master Gateway PCB Case The central chassis designed to house the main electronics. It features internal alignment slots to securely hold the custom gateway PCB, a dedicated cutout for precise ports for the high-gain Ra-01 LoRa antenna.
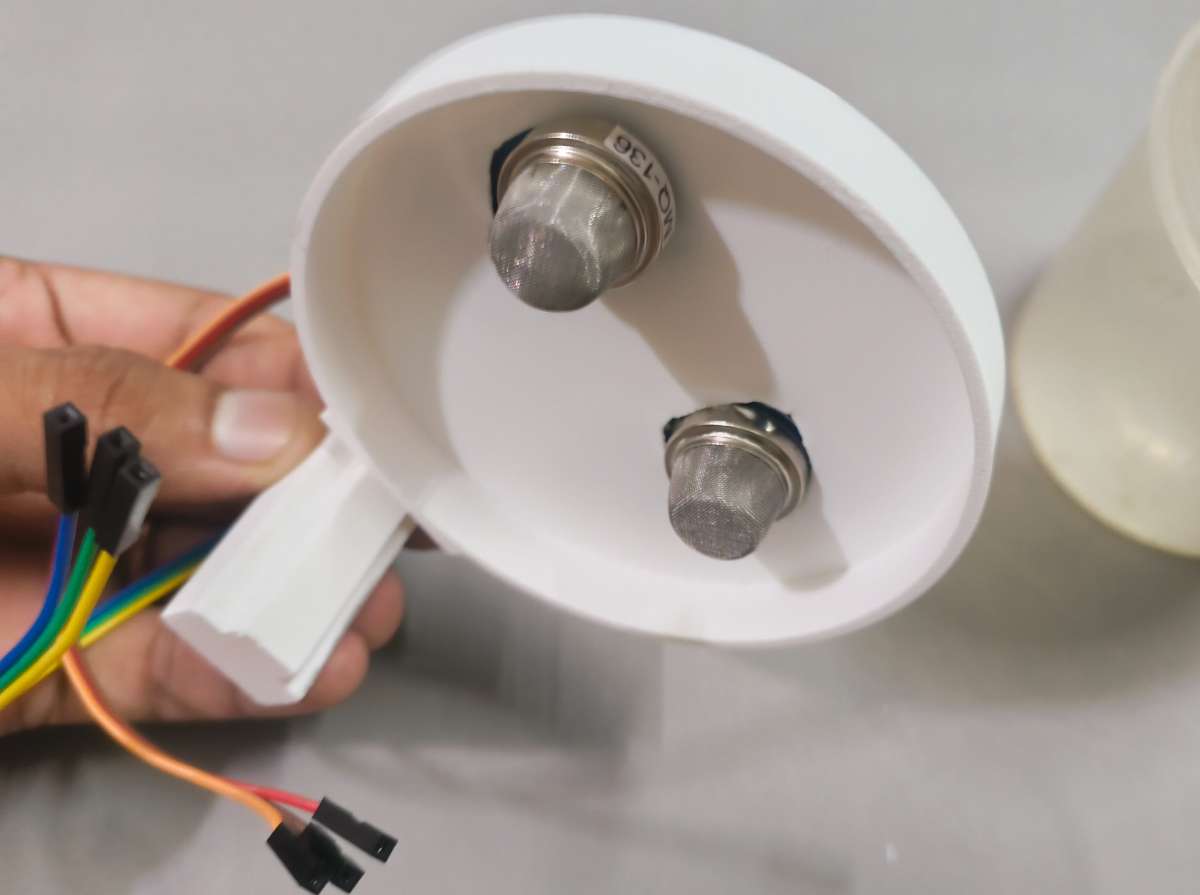
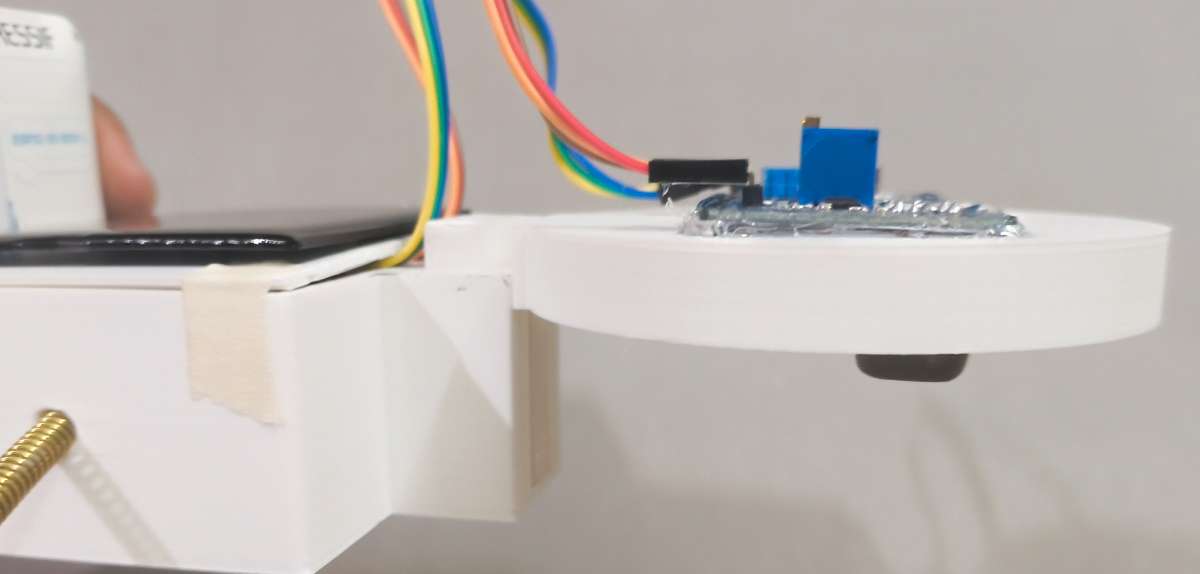
Part 2: The Integrated Cup Holder A specialized mechanical cradle built specifically to hold the Water Testing Cup. This component isolates the physical water collection area from the main electronics case while positioning the MQ135 and MQ136 electrochemical sensors perfectly above the water line to capture rising toxic gases. I engineered a Slider Keyway directly into the structural walls of the PCB Case and the Cup Holder.
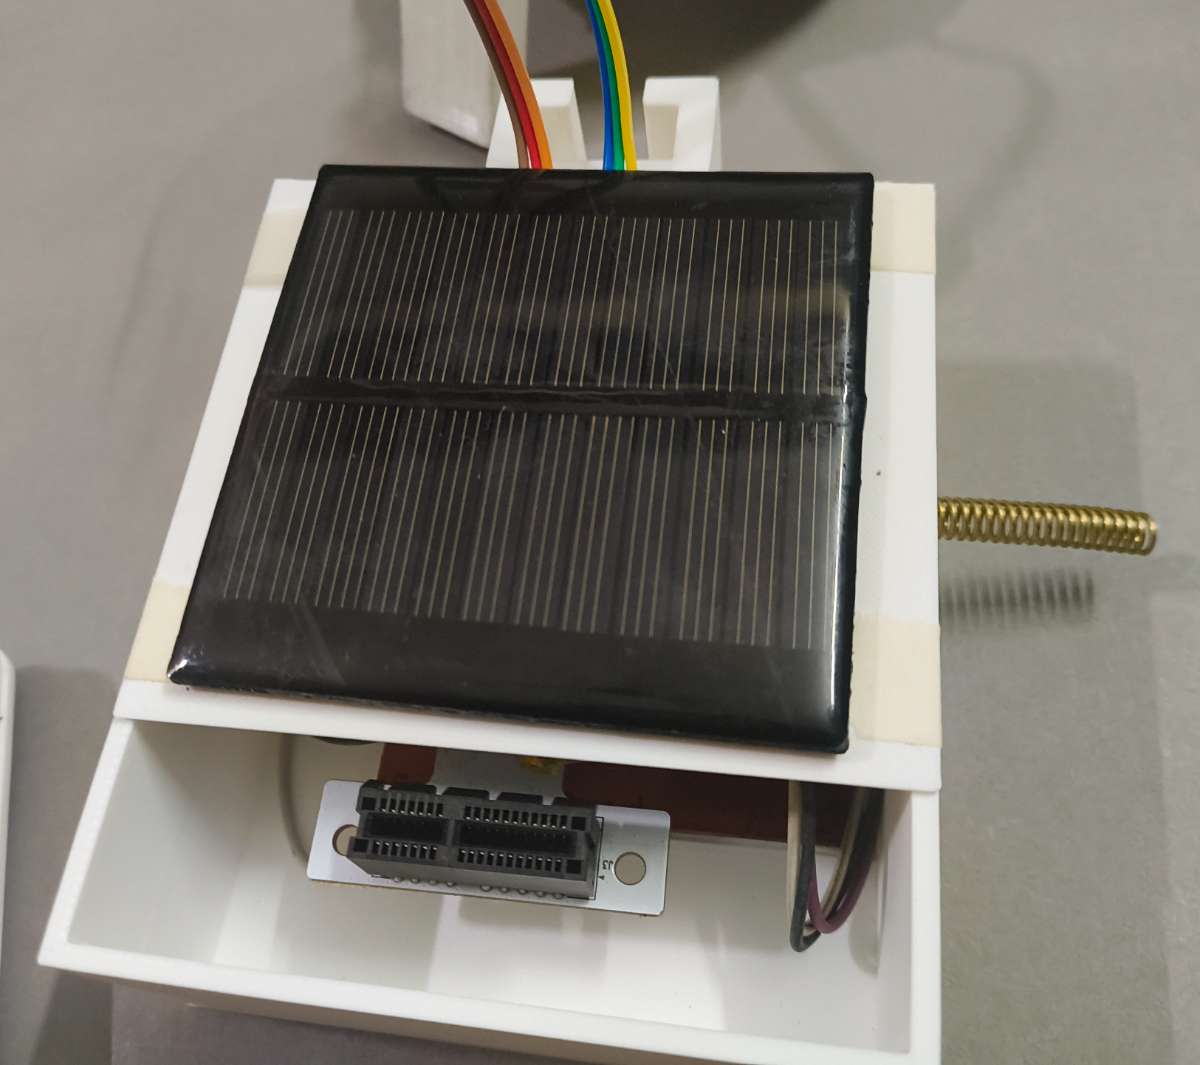
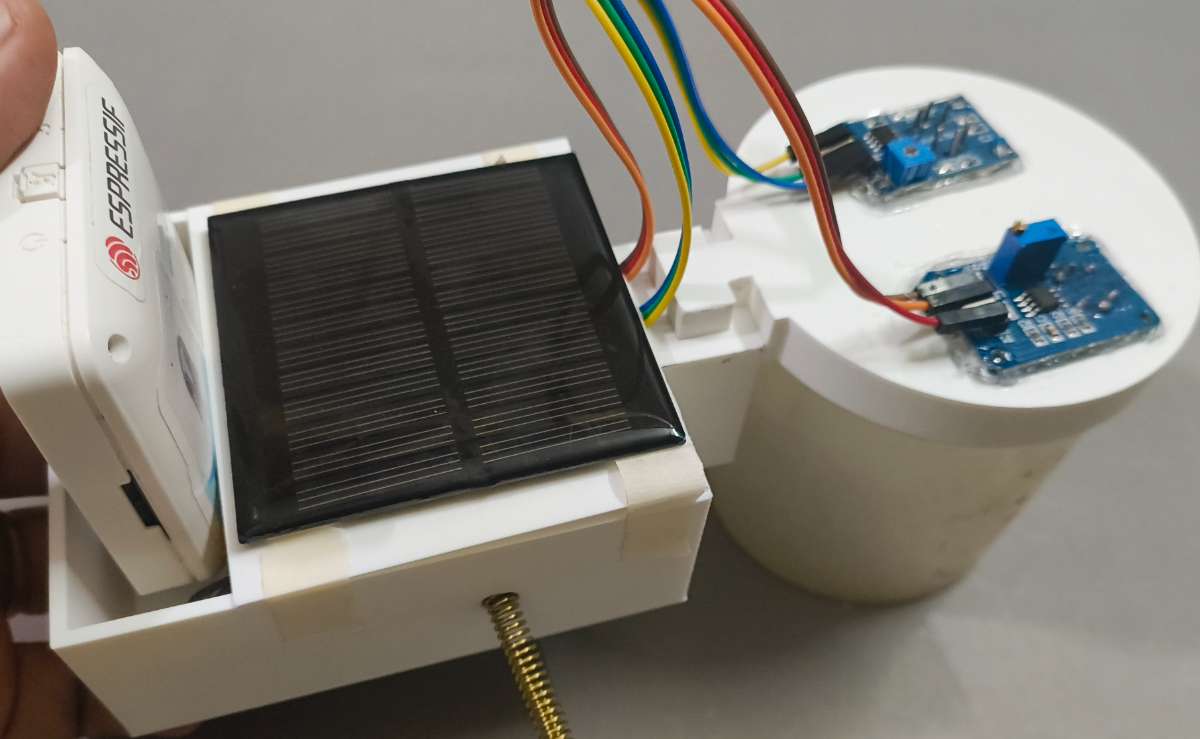
Part 3: The Solar-Harvesting Cover The top lid of the main chassis, engineered with a precise recessed tray designed to mount the gateway's solar panel flush with the surface. The cover protects the internal circuitry from dust and environmental debris while maximizing solar exposure to keep the system powered indefinitely.
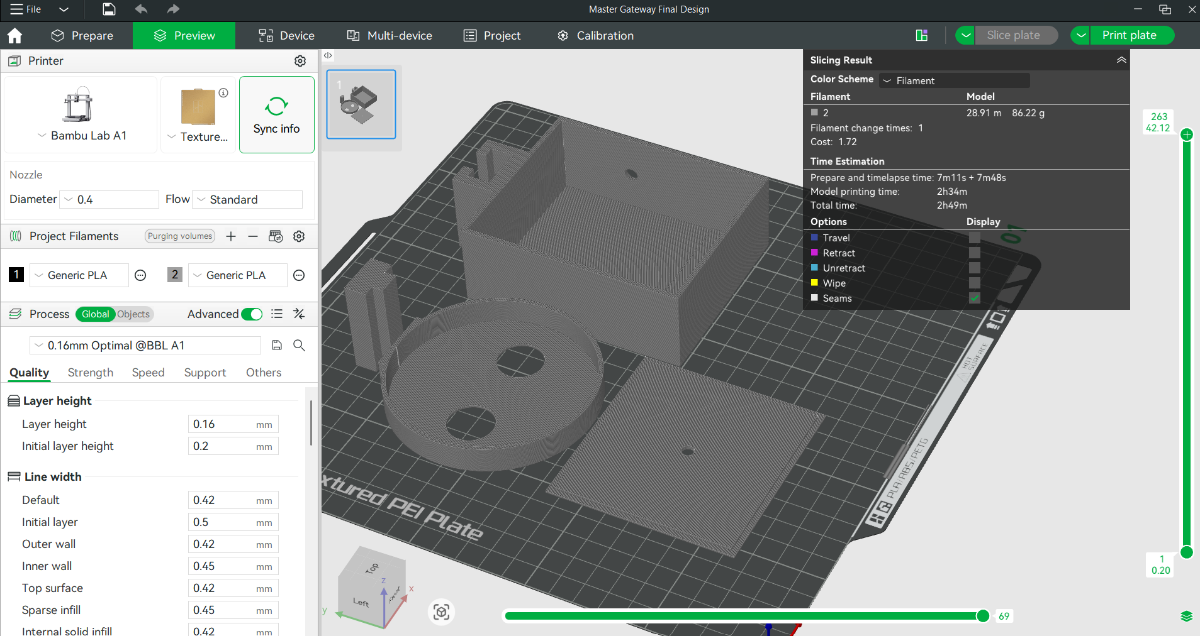
Fabrication & 3D Printing Profile
Production Hardware & Slicing: All models were sliced using Bambu Studio and printed using a high-precision Bambu Lab A1 3D printer, ensuring absolute dimensional accuracy so that the interlocking slider key fits perfectly without binding.
Material Selection (PLA+): I utilized premium PLA+ filament. This material provides enhanced impact resistance and superior interlayer fusion compared to standard filaments, ensuring the structural rails of the slider key do not shear or crack under stress.
Print Optimization Settings:
Nozzle Diameter: 0.4mm (Ensures a sharp, clean finish on internal sliding tolerances)
Layer Height: 0.16mm (Fine resolution to guarantee smooth sliding surfaces along the interlocking keys and a flush fit for the solar cover)
Infill Density & Pattern: 25% Gyroid (Provides uniform, multi-directional structural strength to withstand field handling)
Wall Loops: 3 Layers (Creates a thick, robust external shell, adding rigid strength to the mechanical slider rails and preventing outdoor degradation)
Files for CAD design in available in git hub repository : Link
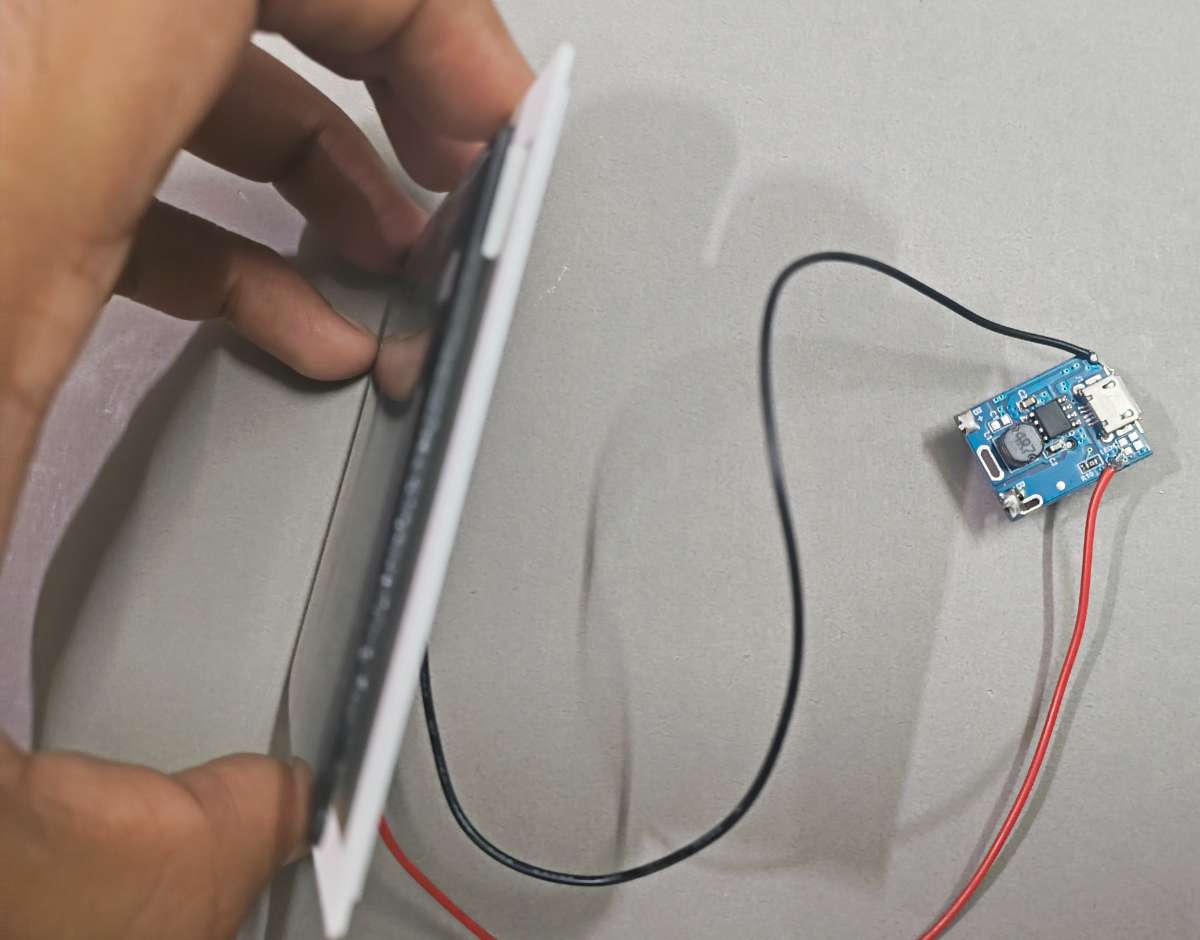
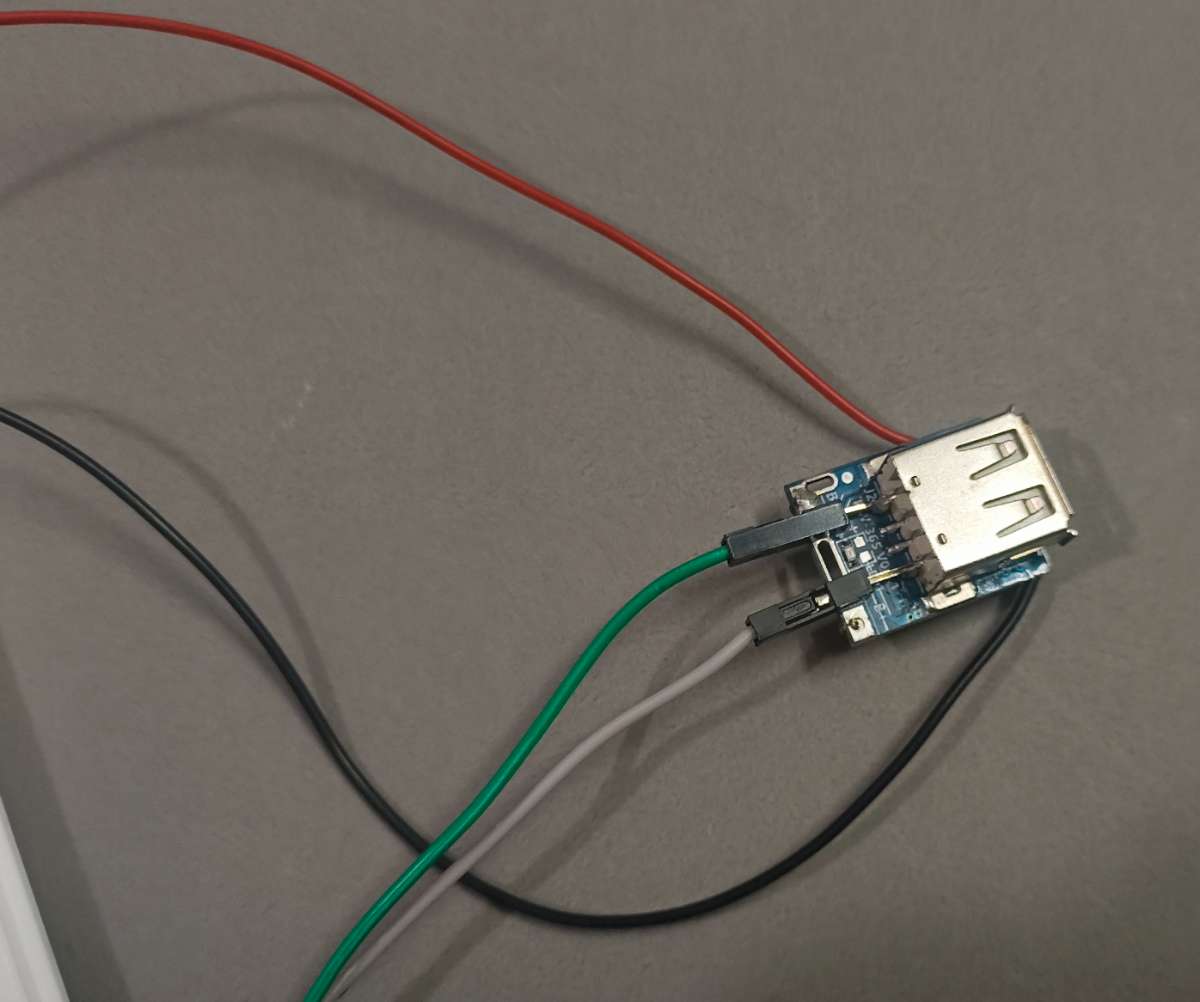
Step 4: Solar Wiring and Power setup
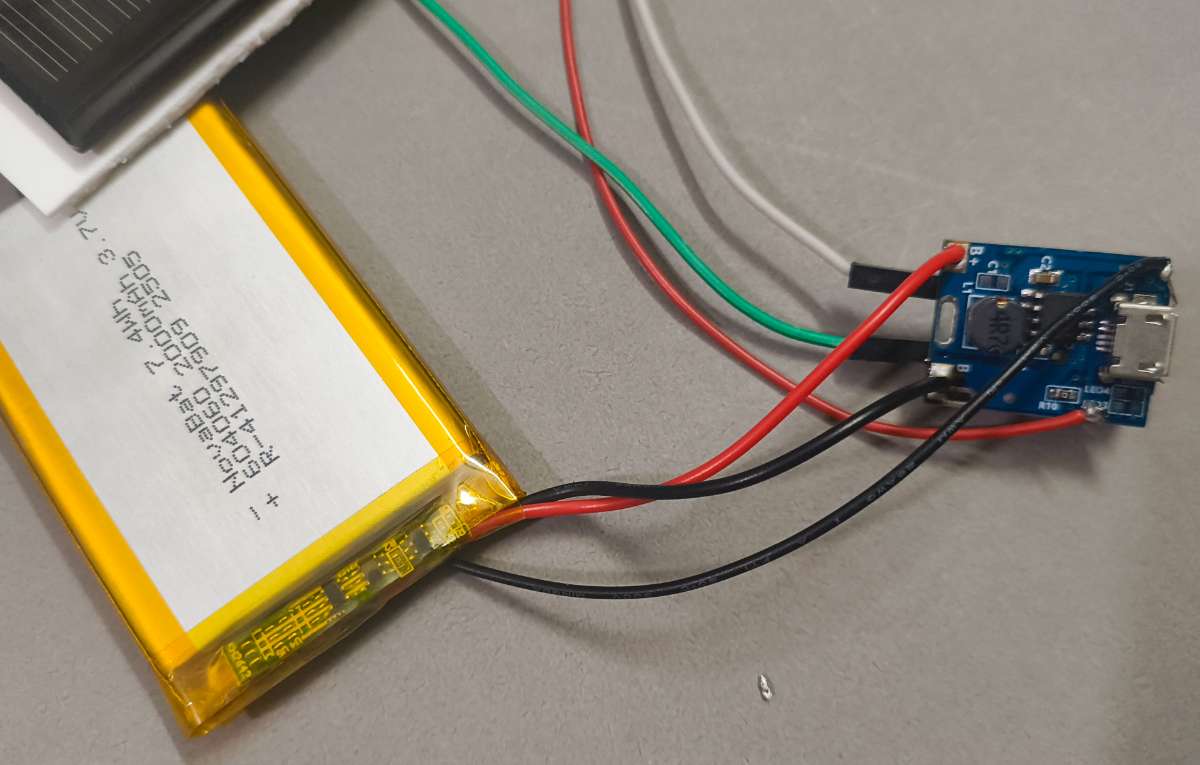
The heart of this setup is the All-in-One 5V Step-Up Charge Controller Module, which acts as a centralized power management system. It dynamically captures variable input voltage from the top-mounted solar panel to charge the integrated Lithium-Polymer (LiPo) backup battery, while simultaneously boosting the battery's raw 3.7V output to a regulated 5V rail. This stable 5V supply is critical, as it simultaneously heats the electrochemical MQ135/MQ136 sensors and powers the onboard low-dropout (LDO) regulator of the ESP32-S3.
The electrical integration was performed using the following standardized execution sequence:
Step 1: Solar Panel Input The positive and negative terminals from the outdoor-rated solar panel (mounted on the case cover) were routed internally and soldered directly to the Solar Input pads (VIN+ / VIN-) on the charge controller module.
Step 2: 5V Regulated Heavy-gauge jumper wires were soldered to the module’s 5V Boost Output pads (VOUT+ / GND). These lines run directly to the main terminal power rails of the custom Master Gateway PCB to drive the entire processing and sensor system.
Step 3: LiPo battery Connection As a safety protocol to keep the booster stable during assembly, the positive (Red) and negative (Black) leads of the 3.7V LiPo backup battery were soldered to the Battery Terminals (B+ / B-) as the absolute final step.
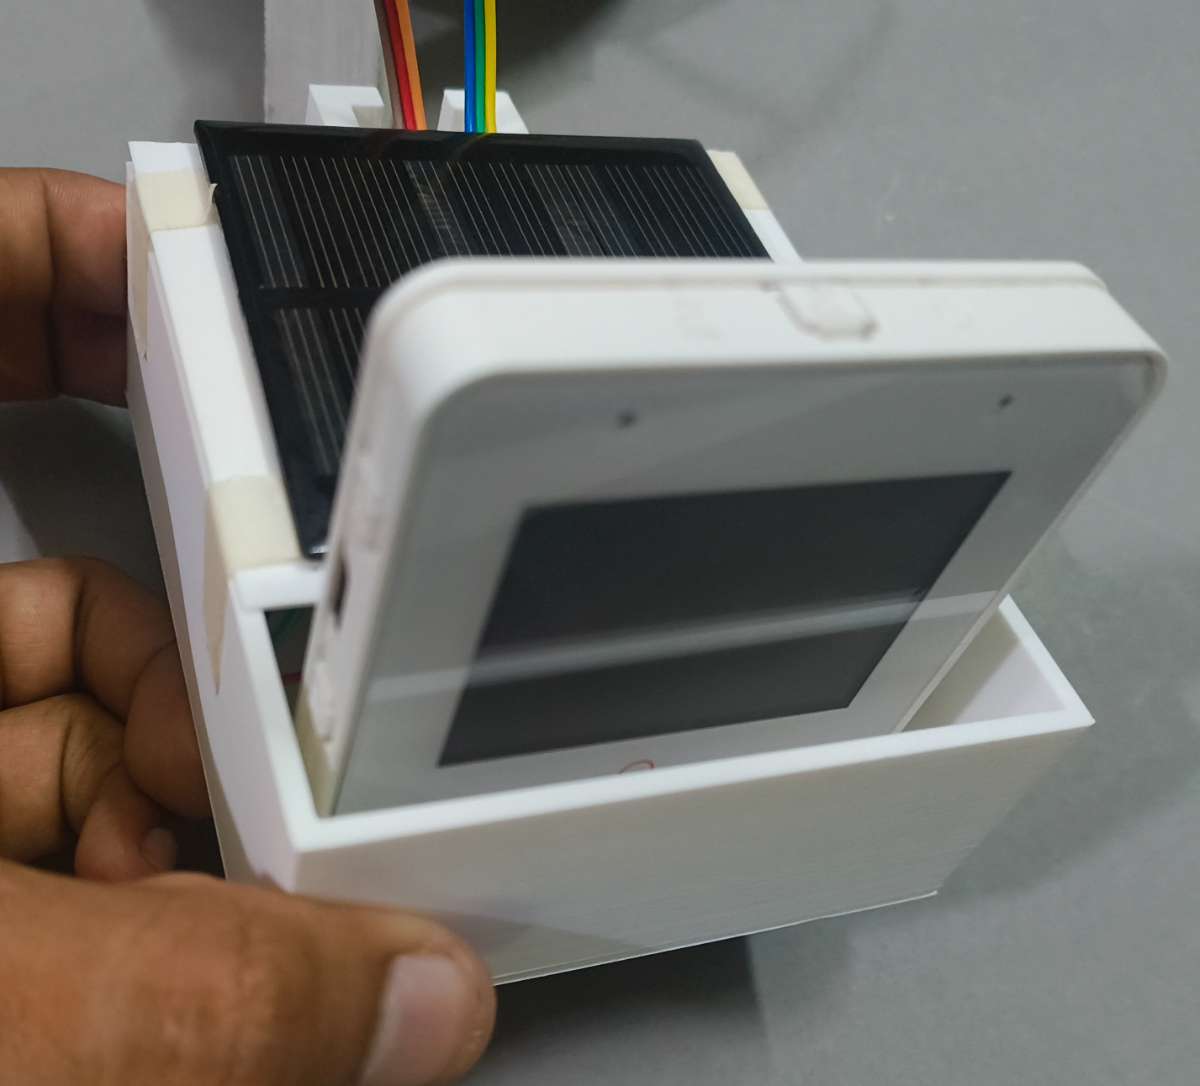
Step 5: Final Housing Assembly & Wiring Integration
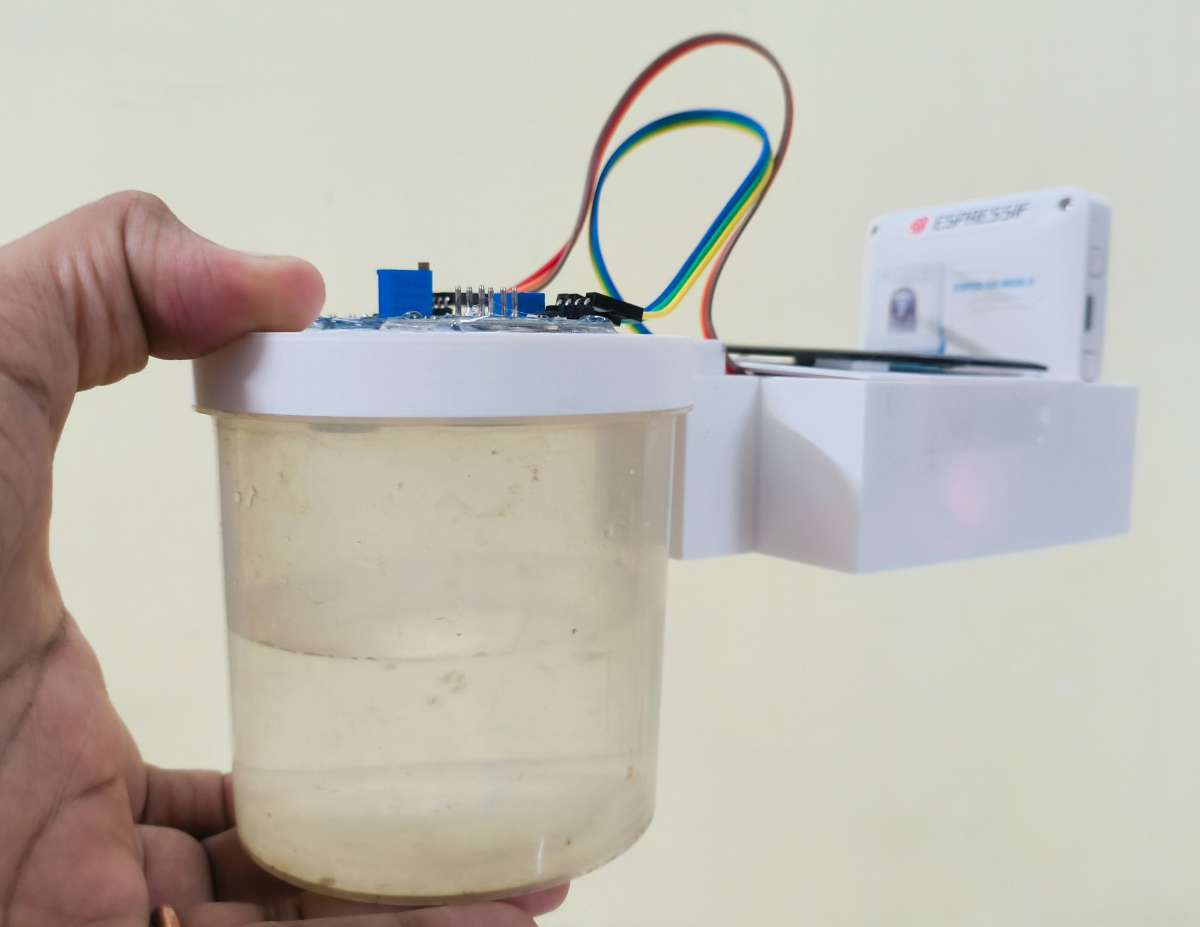
The final assembly of the Master Gateway brings together the computing power of the ESP32-S3 Box 3, the long-range reception of the LoRa module, and the chemical gas analysis suite of the Water Testing Cup.
The mechanical assembly and wiring sequence are executed in the following structured steps:
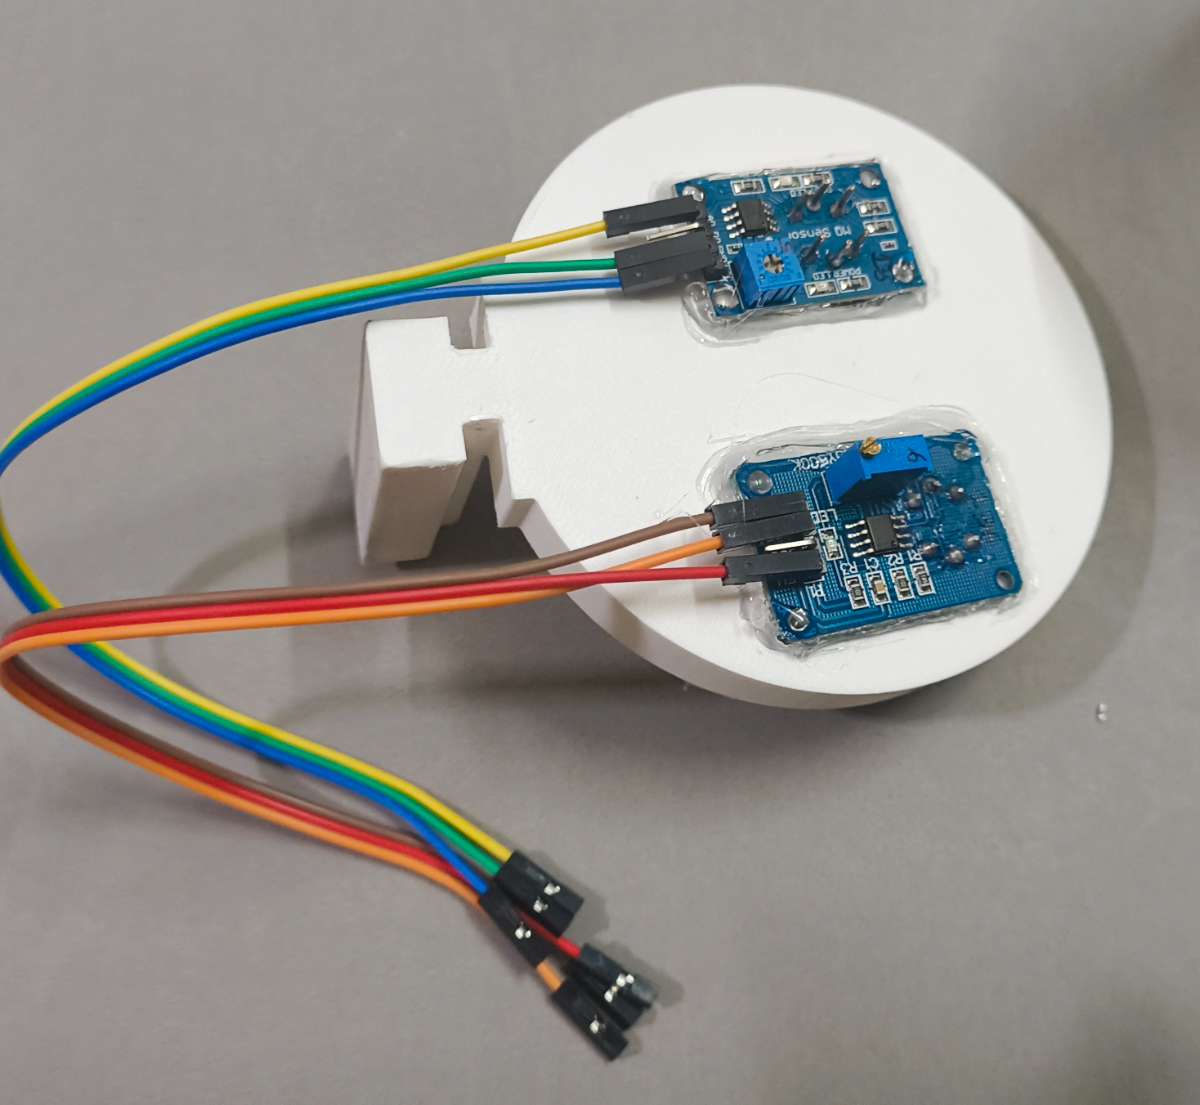
Phase 1: Testing Cup & Component Population
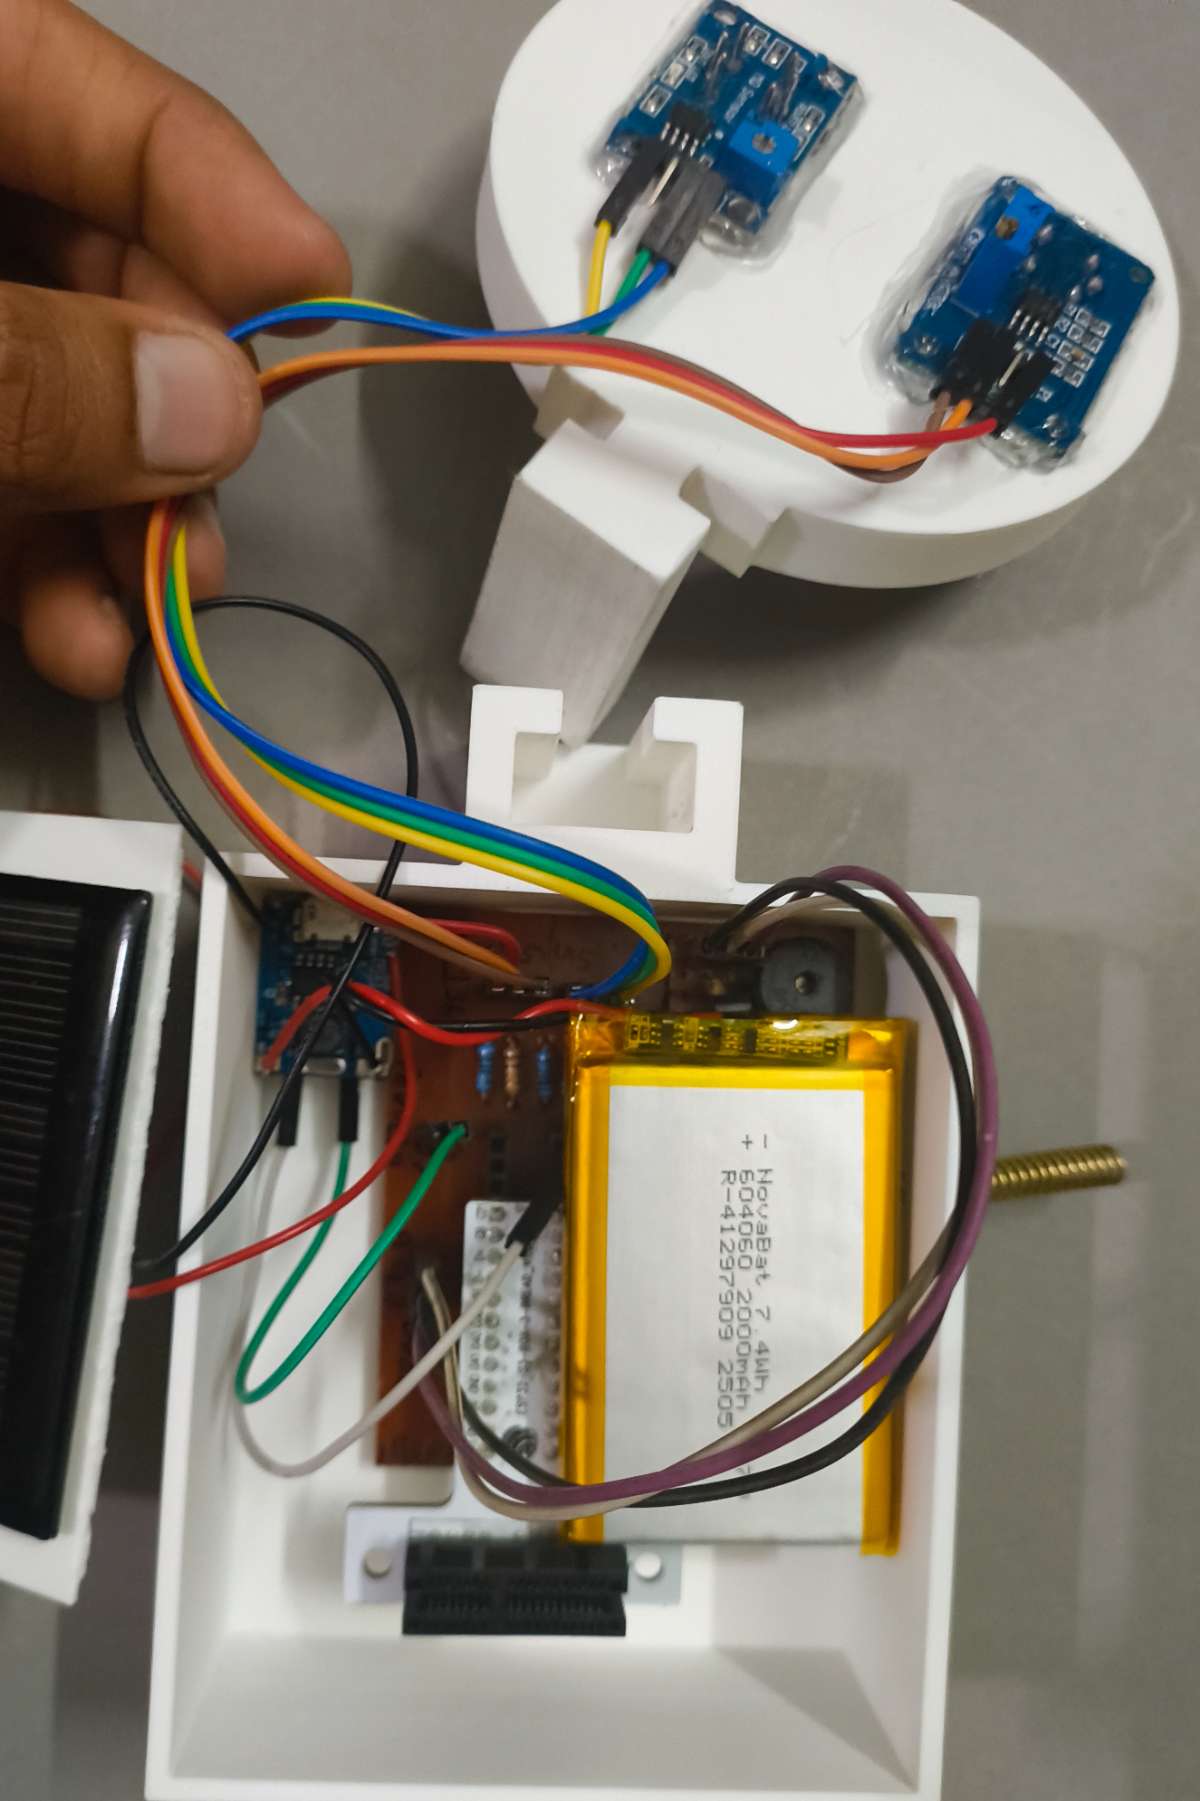
Step 1: Electrochemical Sensor Seating Take the testing cup and cup holder assembly. Position the MQ135 (Ammonia) and MQ136 (H2S) sensors perfectly inside their designated mounting slots above the fluid collection chamber. Secure the sensor bodies firmly to the walls using a hot glue gun, creating an airtight seal around the base of the sensor housings to capture rising sewer gases cleanly.
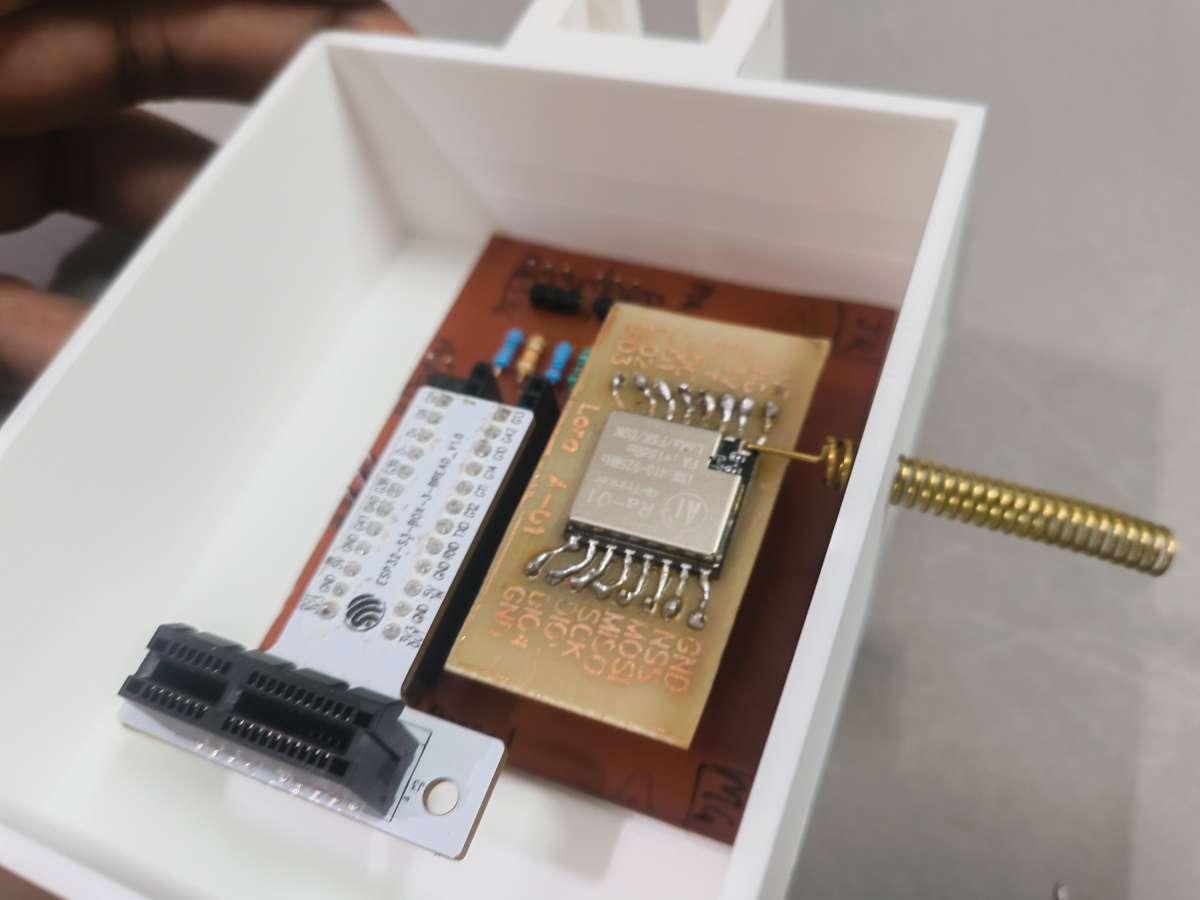
Step 2: Core Module Header Population Plug the Ra-01 LoRa module and the ESP32-S3 Box 3 breadboard extension adapter firmly into their respective female pin headers on the custom gateway PCB. Double-check the alignment to confirm all pins slide in cleanly without bending.
Phase 2: Main Case Mounting & Power Placement
Step 3: Base PCB Securing & Antenna Routing Apply a layer of heavy-duty, high-bond double-sided tape to the bottom of the populated gateway PCB. Carefully lower the board into the main 3D-printed chassis. While lowering, guide the helical LoRa antenna cleanly through the pre-drilled antenna egress hole on the side of the case. Press the PCB down firmly to lock it into the base of the housing.
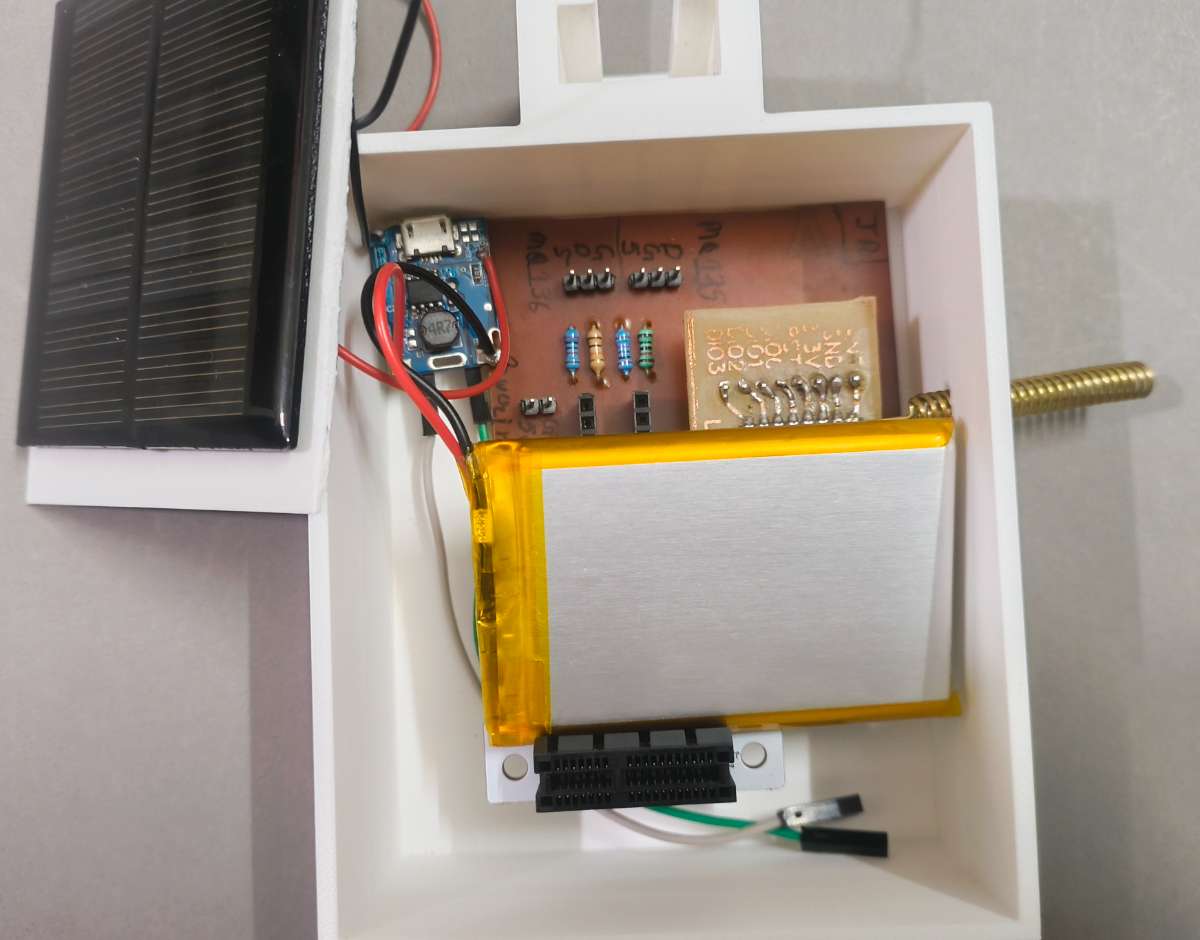
Step 4: Energy Module Integration Mount the 5V Step-Up Charger module and the compact LiPo backup battery into their designated internal cavities adjacent to the PCB using high-bond double-sided tape, keeping the battery clear of any sharp component pins on the underside of the board.
Phase 3: System Routing & Local Alarm Wiring
Step 5: Sensor, Buzzer, and Power Harnessing Mount the 3.3V active alarm buzzer into its acoustic cutout within the chassis.
Route the wire bundles from the external MQ sensors and the solar panel into the case through the designated wiring paths.
Carefully plug each individual wire harness—including the sensors, buzzer, and power lines—into its designated male header block on the main PCB using your connection matrix.
Organize any slack wire neatly using small ties to ensure a clean interior layout.
Step 6: Solar Cover Attachment Align the matching top case cover (holding the pre-mounted solar panel) over the main chassis walls. Snap or fasten the cover securely in place to protect the underlying routing lines from ambient dust and moisture.
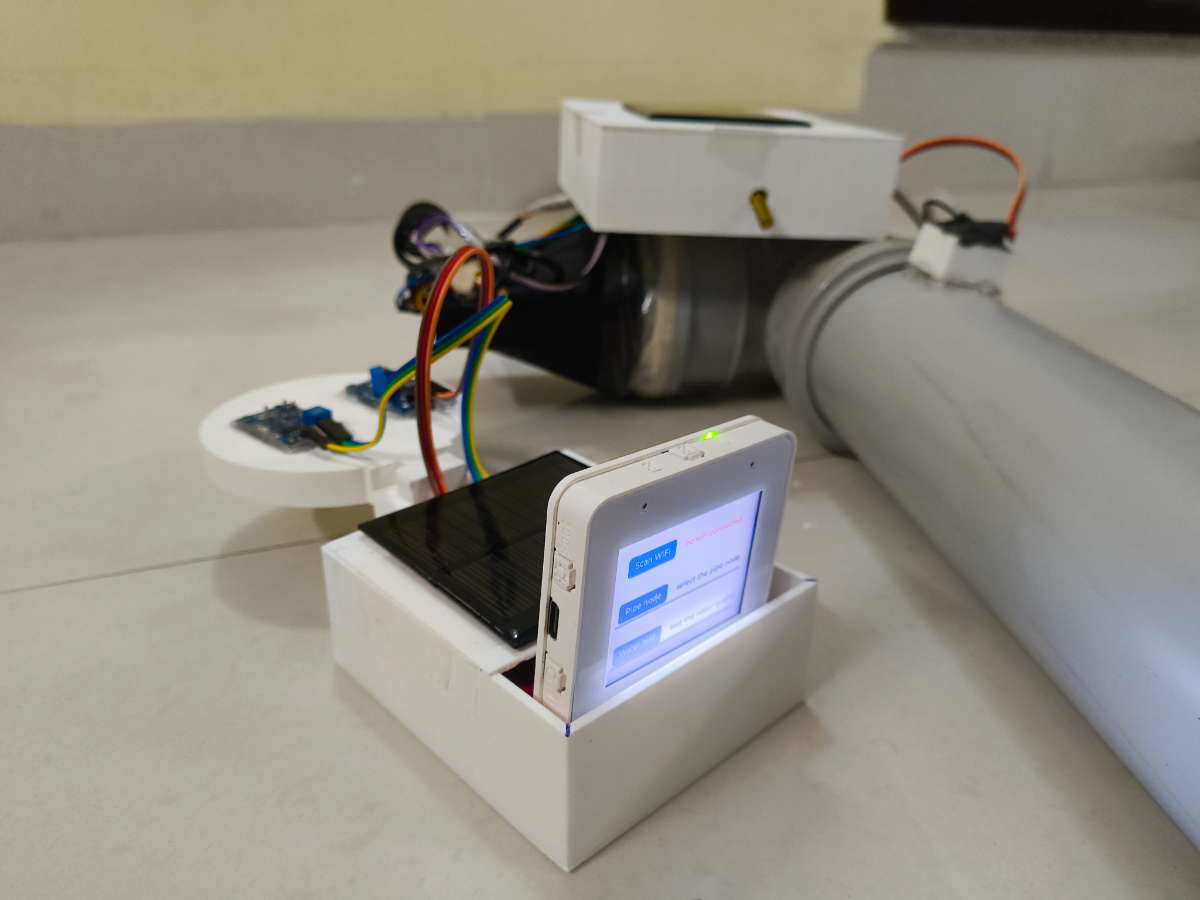
Step 7: Main Compute Module Docking Mount the primary ESP32-S3 Box 3 master display module directly onto the exposed breadboard extension interface protruding from the top of the case. Press down evenly until the module sits flush against the housing, giving the gateway its localized dashboard capability.
Step 8: Interlocking Key Slide Docking Align the integrated Slider Key on the side of the completed Water Testing Cup holder with the matching receiving slot on the side of the main gateway case. Slide the cup holder down smoothly until it locks securely into place through geometric friction.
Final Validation Check
With the completion of Step 5, the physical assembly of your Jal Rakshak Master Gateway is fully complete. The system is structurally unified, completely self-powered, and ready for deployment.
Part B: Code & Cloud Deployment (Master Gateway)
The Master Gateway is the central nervous system of the Jal Rakshak network. While the Pipe Nodes operate deep underground on ultra-low-power sleep cycles, the Master Gateway operates above ground in a continuous listening state. It aggregates encrypted LoRa emergency packets, performs localized biochemical gas validation, sounds physical alarms, and pushes actionable telemetry to the cloud.
This section details the configuration of the cloud backend, the local development environment, and the firmware logic that drives the ESP32-S3 Box 3.
Step 1: Database Setup
Before the gateway can push emergency telemetry to the internet, we must configure the receiving cloud infrastructure. To handle the high-frequency JSON payloads coming from the Master Gateway, the system utilizes Google Firebase Realtime Database. This acts as the high-speed bridge between our physical hardware and the municipal dashboard.
Here is the step-by-step configuration to establish this cloud link:
Name the project (e.g., Jal-Rakshak-Indore) and click Continue. (Google Analytics can be disabled for this hardware prototype).
Wait for the provisioning sequence to finish and click Continue to enter your new dashboard.
2. Initialize the Realtime Database
On the left sidebar, navigate to Product categories then Databases & Storage → Realtime Database and click Create Database.
Choose a server region closest to your deployment (e.g., asia-south1 for India) to minimize latency.
For rapid prototyping and testing, select Start in Test mode. This allows the ESP32-S3 to read and write data without complex OAuth flows (Note: Firebase allows open test rules for 30 days before locking).
Once created, look at the top of the Data tab and Copy the Database URL. (It will look like: https://<your-project-id>.firebasedatabase.app/).
Keep this URL handy; it will be defined as FB_HOST in your Arduino sketch.
3. Generate Hardware Authentication Tokens
To allow the ESP32-S3 to securely POST data using HTTPS REST API calls, it requires a secret authentication token.
Click the Gear Icon (Project settings) next to Project Overview.
Navigate to the Service accounts tab.
Click on Database secrets.
Click Show and copy the alphanumeric secret string.
Keep this string safe; it will be defined as FB_AUTH in your Arduino sketch.
4. Configure the Web App (For the IMC Web Portal)
Finally, you need to generate the frontend configuration keys so your web dashboard can pull the data the Master Gateway uploads.
Go to Project Overview and select Add app button then click the Web icon (</>) to add a new app.
Name the app (e.g., IMC-Web-Portal) and click Register app.
Firebase will generate a custom Web SDK configuration block containing your frontend API keys. It looks like this:
Copy these values. You will paste them directly into your frontend development platform (like React, HTML/JS, or Lovable.dev but mainly i am using Streamlit python ) to link the visual IMC Web Portal to the live hardware data stream.
Step 2: Arduino IDE Setup (Master Gateway)
The Master Gateway firmware transforms the ESP32-S3 Box 3 into a high-performance, multitasking command center. Because it handles an interactive LVGL touchscreen, real-time LoRa decryption, and encrypted SSL cloud uplinks simultaneously, configuring the Arduino IDE correctly is critical.
1. Board & Hardware Configuration
Navigate to Tools -> Board -> ESP32 Arduino and select ESP32S3 Dev Module.
USB CDC On Boot: Set to Enabled. This ensures the gateway can print critical Firebase connection logs over the USB-C port during debugging.
PSRAM: Set to OPI PSRAM. The LVGL display buffers require external RAM to render the UI smoothly.
Partition Scheme: Set to Huge APP (3MB No OTA/1MB SPIFFS). The compiled FirebaseClient and LVGL libraries are large and require this extra space.
2. Required Library Dependencies
Install the following libraries via the Arduino Library Manager:
LovyanGFX: The high-speed display driver utilized for the touchscreen hardware.
lvgl (Version 8.3.x): The graphics engine powering the interactive menus. (Note: Do not install v9, as it introduces breaking API changes).
FirebaseClient (by Mobizt): The modern, asynchronous library used to push data to Google's Realtime Database without freezing the screen.
LoRa (by Sandeep Mistry): Configured on a dedicated SPI2 bus to prevent conflict with the display.
MQUnifiedsensor: Handles the logarithmic regression math for the biochemical gas sensors.
3. Pre-Upload Configuration (Cloud Credentials)
Before clicking "Upload" in the Arduino IDE, you must link the firmware to the Firebase infrastructure we built. Open the JalRakshakMasterGateway code and locate the Firebase Credentials section near the top.
You must replace the placeholder values with the exact keys copied from your Firebase Console. This step is strictly required for the device to authenticate and write to the cloud database:
The firmware operates on a Strict Non-Blocking Architecture. It abandons delay() functions entirely, opting for millisecond tick counters to seamlessly juggle the UI, radio, and cloud.
1. The LoRa Telemetry Payload (C-Struct)
To ensure zero data corruption over the 433MHz radio waves, the gateway and the Pipe Nodes share an identical struct. The #pragma pack(push, 1) command forces the ESP32 to align the memory perfectly, allowing the gateway to unpack the incoming binary bytes instantly without heavy string parsing.
When data is generated, the gateway uses the asynchronous Database.set() command to push information to two distinct directories in your Firebase project. It also stamps each payload using an NTP server (pool.ntp.org):
Route A (Underground Network Sync): When a LoRa packet arrives, the gateway pushes the live Pipe Node telemetry to /nodes/node_[ID].
Route B (Localized Water Testing): When a municipal worker runs a physical water cup test, the MQ135 and MQ136 PPM readings are calculated and logged to /lab_results/[timestamp].
If the unpacked LoRa payload contains an active leakAlert or emergencyFlag, the Master Gateway immediately triggers a physical buzzer. This ensures that even if the internet goes down, the localized hardware alarm still notifies technicians in the immediate vicinity.
// 🚨 BUZZER ALARM LOGIC 🚨
if (incomingData.emergencyFlag || incomingData.leakAlert || incomingData.waterPresence) {
    digitalWrite(BUZZER_PIN, HIGH); // Sound the alarm
} else {
    digitalWrite(BUZZER_PIN, LOW);  // Silence the alarm
}
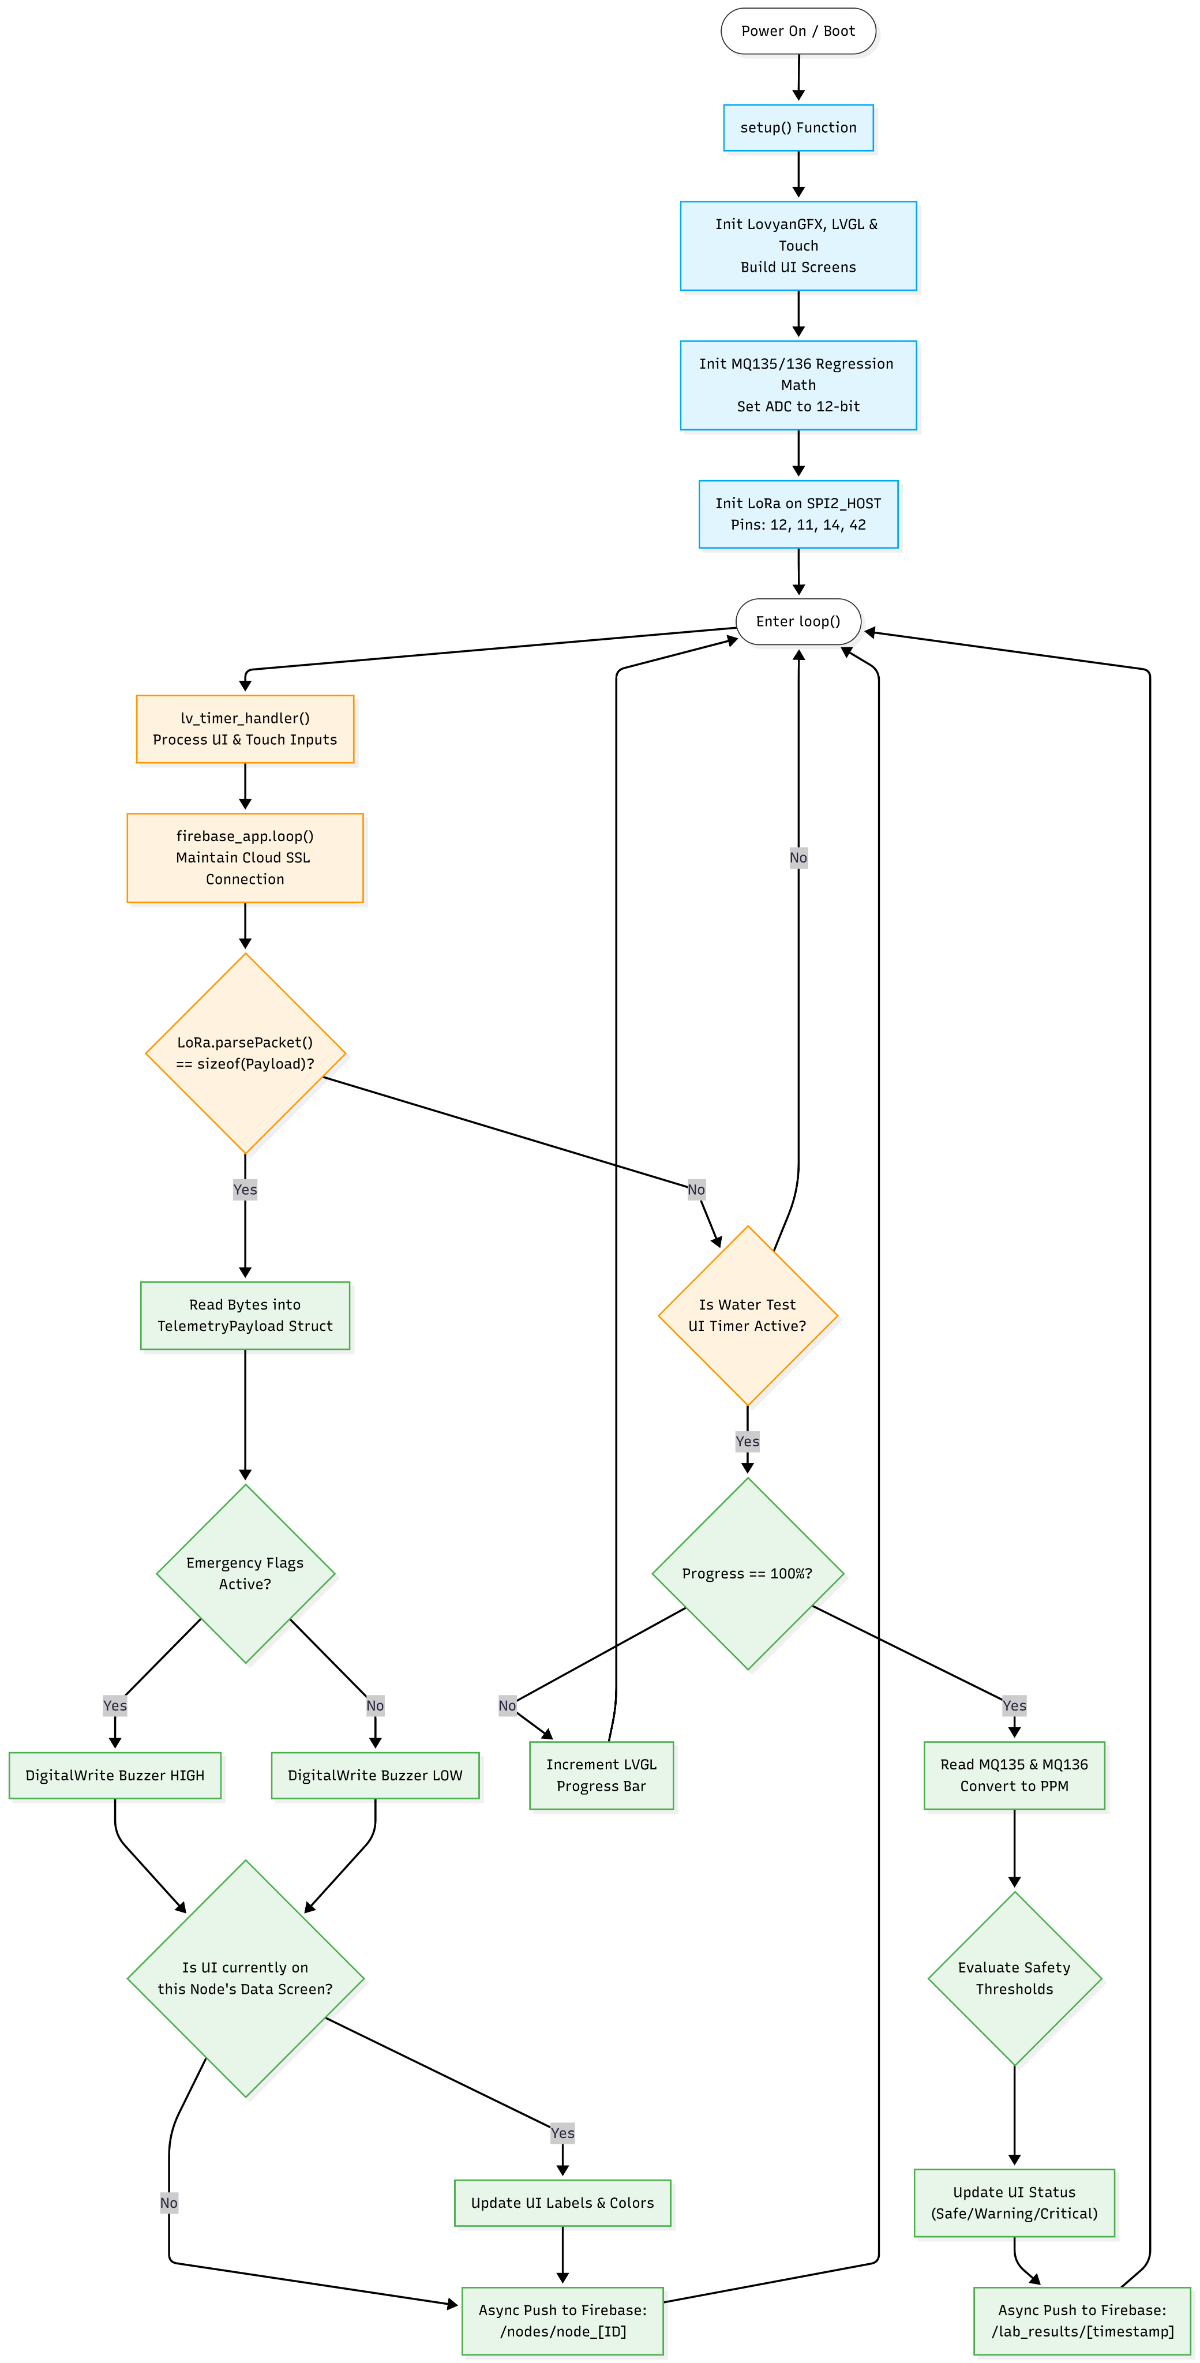
4. Master Gateway Operational Flowchart
This flowchart visualizes the exact execution loop of the gateway code, demonstrating how it balances the UI, the cloud, and the LoRa radio without blocking operations.
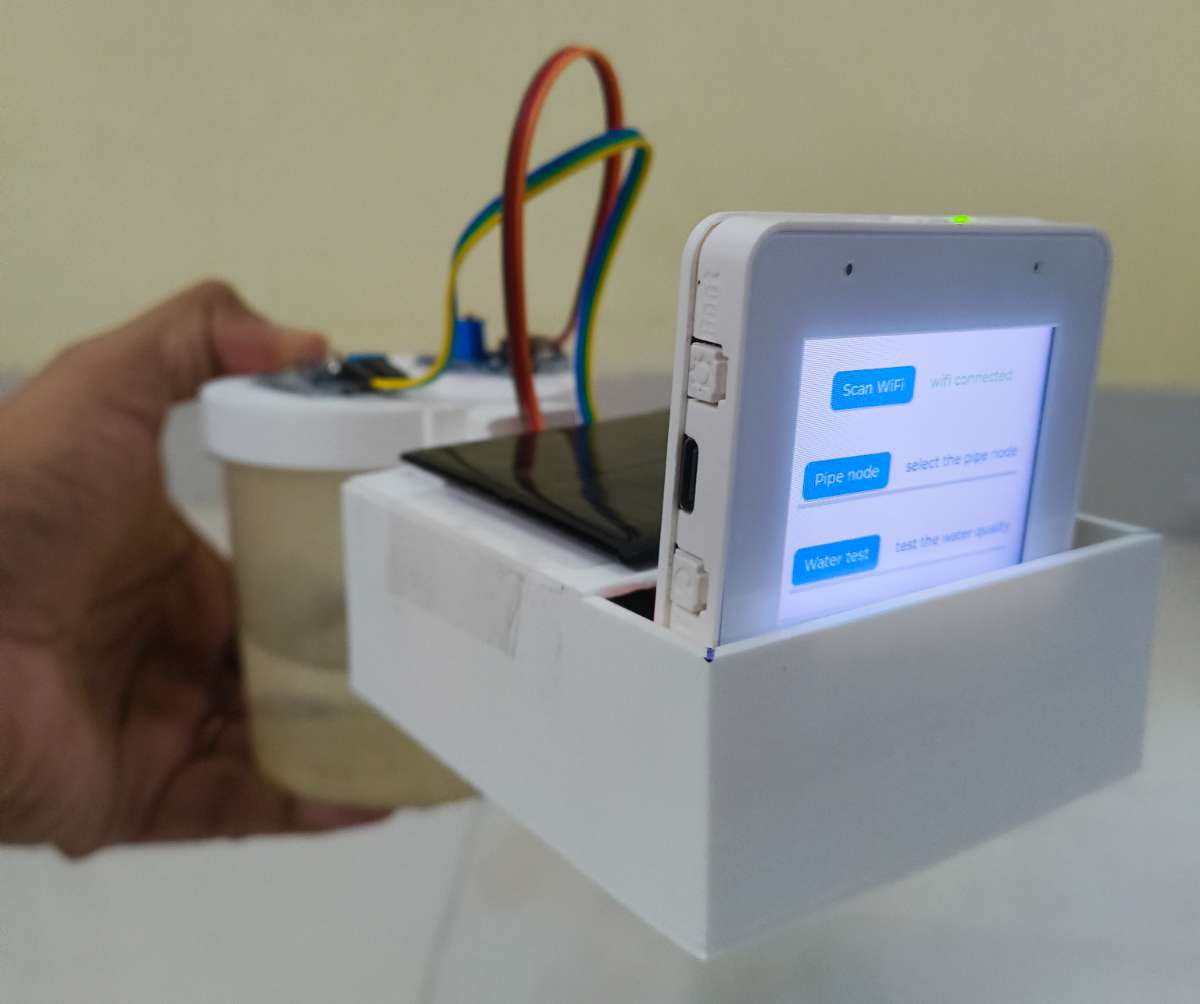
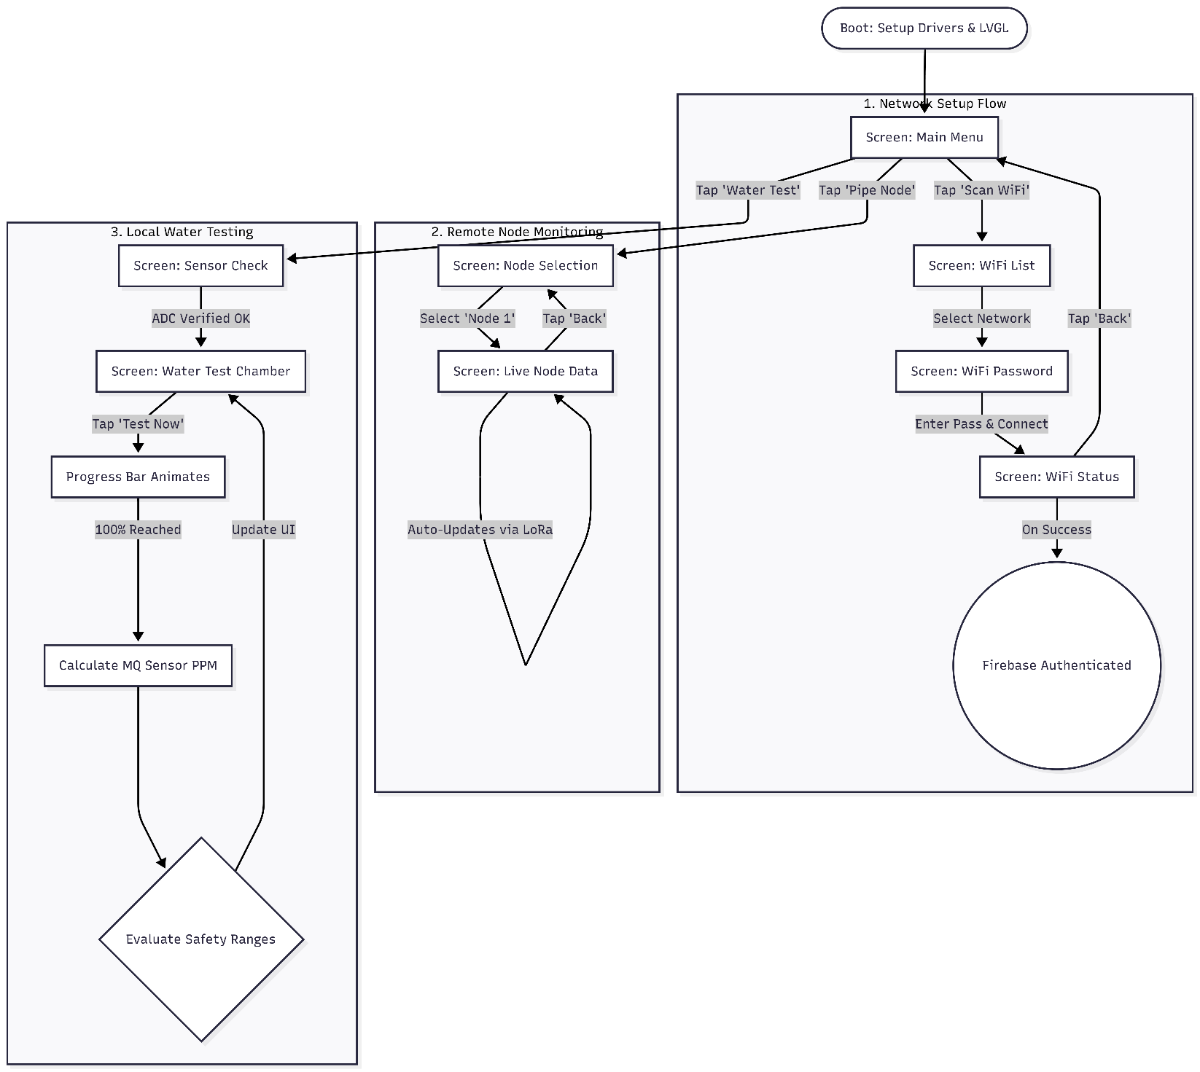
Interactive UI Flowchart
To make the system usable for municipal technicians on the ground, I designed a smartphone-like menu system. This visual flow allows a user to connect to the internet, monitor remote nodes, or run a local chemical water test without ever needing a computer.
Here is the flowchart mapping the interactive UI navigation programmed into the gateway:
Once this code is flashed, the Master Gateway transforms from a simple microcontroller into a fully interactive, cloud-connected command center, perfectly mirroring the professional touchscreen UI workflows .
5. Biochemical Sensor Safety Thresholds
To ensure realistic and safe readings, the safety logic evaluates the calculated PPM from the MQUnifiedsensor library against the following thresholds:
Ammonia NH3 (MQ135 Sensor)
0.0 – 1.9 PPM:SAFE (Normal background levels).
2.0 – 9.9 PPM:WARNING (Mild Sewage Contamination. Indicates possible agricultural runoff or minor wastewater mixing).
0.5 – 1.9 PPM:WARNING (Mild detection. H2S is highly toxic; even low levels indicate decaying organic matter or raw sewage ingress).
2.0+ PPM:CRITICAL ALARM (Severe Sewage Contamination. Poses an immediate biological and respiratory threat).
Files for Master Gateway main code is in github repository : Link
6. The IMC Dashboard (Cloud Integration)
To give municipal authorities real-time visibility over the entire Jal Rakshak network, the project features a centralized web portal: the Infrastructure Monitoring Center (IMC).
Instead of relying on complex, heavy web frameworks, the IMC Dashboard is built entirely in Python using Streamlit. It acts as a serverless front-end that directly queries our Google Firebase Realtime Database to visualize the live data streaming from both the underground Pipe Nodes and the above-ground Master Gateway.
Here is a high-level breakdown of how the IMC web portal functions:
1. Secure Firebase REST Integration
The dashboard communicates with the hardware's cloud backend using the Firebase REST API. To ensure the data is accessed securely without exhausting API rate limits, the code implements a smart caching mechanism:
Token Authentication: The app sends the hardcoded Firebase Web API Key, admin email, and password to the Google Identity Toolkit to receive a secure idToken.
Smart Caching (@st.cache_data): To prevent the app from requesting a new authentication token on every single page refresh, the token generation function is cached with a Time-To-Live (TTL) of 300 seconds (5 minutes).
Data Fetching: The fetch_db() function uses this secure token to pull live JSON payloads directly from specific directory paths (like /nodes or /lab_results) in the Firebase database.
2. Tab 1: Live Mesh Nodes (Infrastructure Telemetry)
The primary interface is dedicated to tracking the underground pipeline network. When a municipal engineer selects a specific node from the dropdown menu, the portal dynamically queries nodes/node_{node_id} and renders the following widgets:
Critical Metrics: Displays high-visibility KPI cards for the node's current pH, TDS, Turbidity, and Temperature. It also features a dynamic "Leak Status" indicator that flashes "ALERT" if the Edge AI acoustic model detects a pipe fracture.
Time-Series Analysis: The app injects the live data into a Pandas DataFrame and uses Plotly Express to render an interactive bar chart. This allows operators to visually compare the current physical parameters of the water supply at a glance.
Live Geographic Mapping: Using the GPS coordinates (latitude and longitude) transmitted by the node's payload, the dashboard utilizes Streamlit's native st.map() function to pinpoint the exact location of the hardware in the city.
Below is template for node 1 Data viewer:
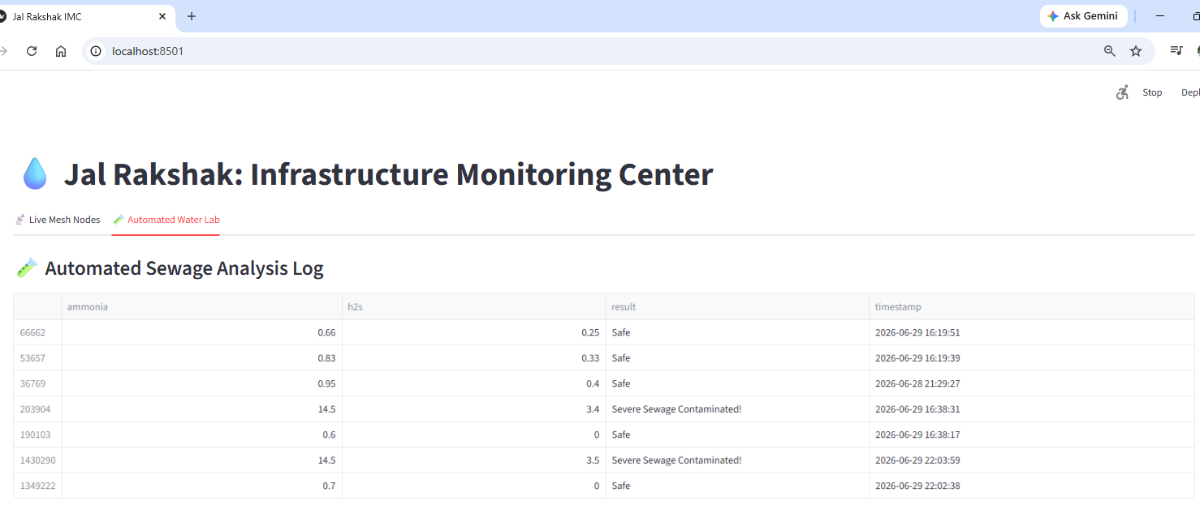
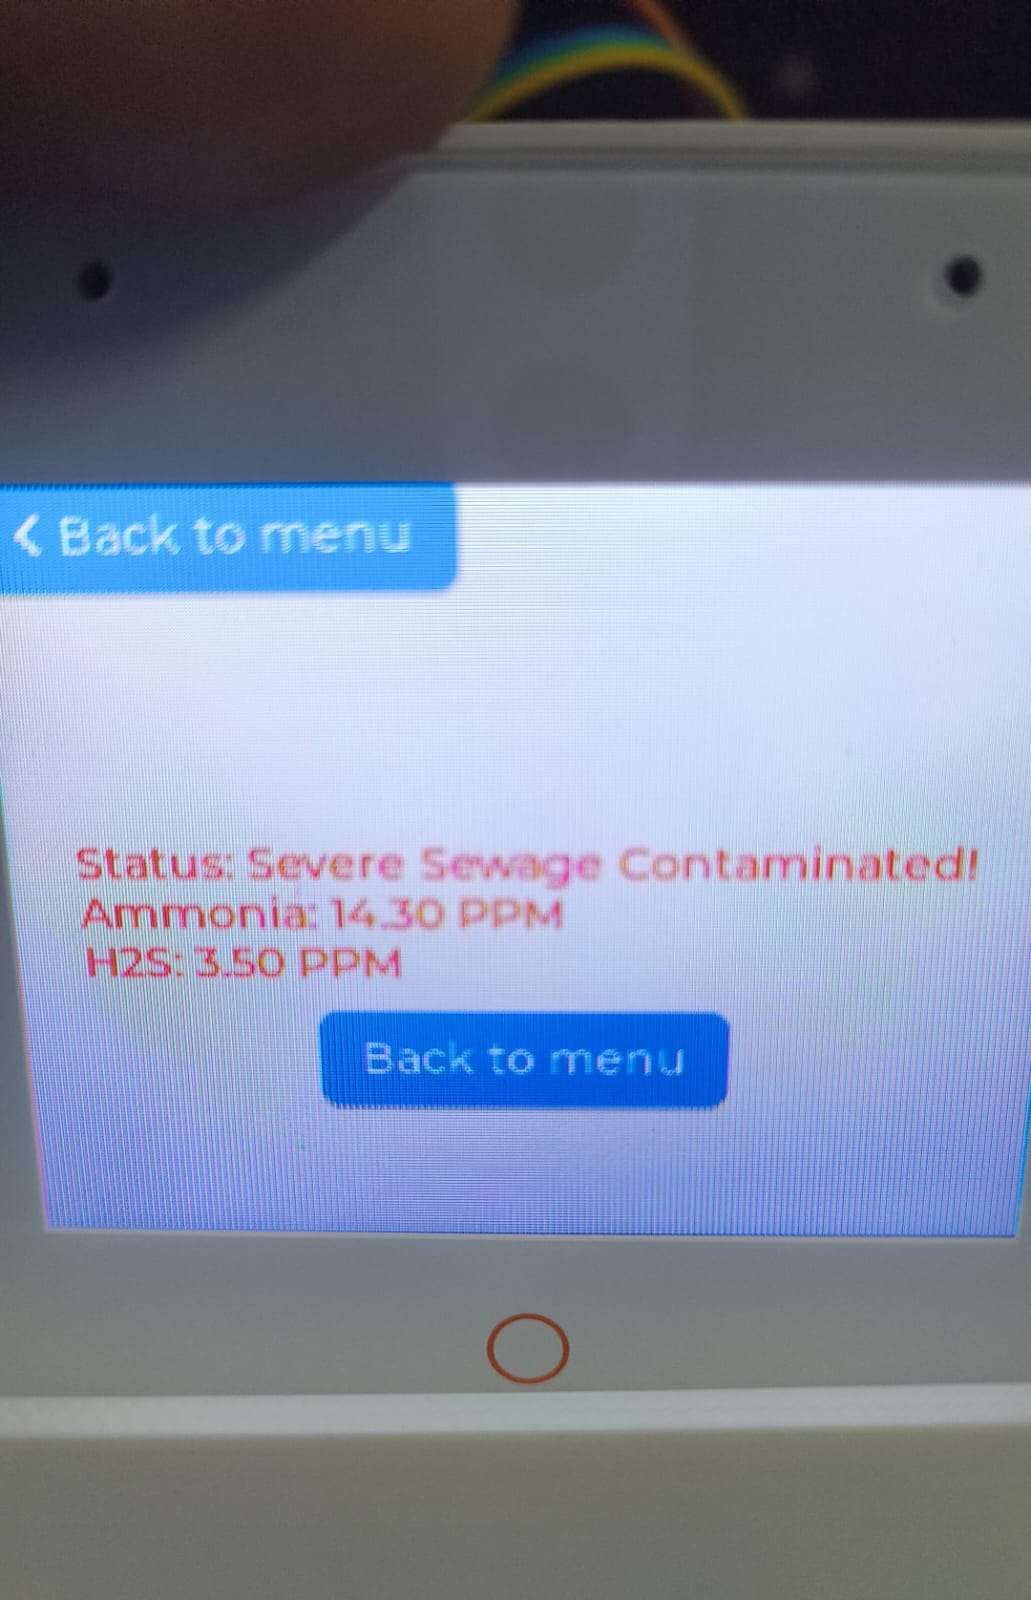
3. Tab 2: Automated Water Lab (Biochemical Logs)
While Tab 1 monitors continuous underground data, Tab 2 acts as a historical ledger for the localized spot checks performed at the Master Gateway.
The app queries the /lab_results directory in Firebase.
It pulls down the timestamped Ammonia NH3 and Hydrogen Sulfide H2S PPM readings, alongside the calculated safety status (e.g., "Severe Sewage Contaminated!").
This data is converted into a sorted Pandas DataFrame and displayed as a clean, interactive table, giving the city a permanent record of all manual water quality investigations.
4. Real-Time Auto-Refresh Loop
To ensure the IMC Dashboard always reflects the absolute latest infrastructure state, the sidebar includes a "Live Refresh" toggle. When enabled, the Python script executes a time.sleep(3) delay and then triggers st.rerun(). This creates a continuous 3-second polling loop, constantly pulling fresh telemetry from the Firebase cloud without requiring the user to manually refresh their browser.
Files for Web portal are in Github repository : Link
7. Real-World Simulation & Testing
The following physical simulations were conducted to test the millisecond-response times of our Edge AI and FreeRTOS architecture:
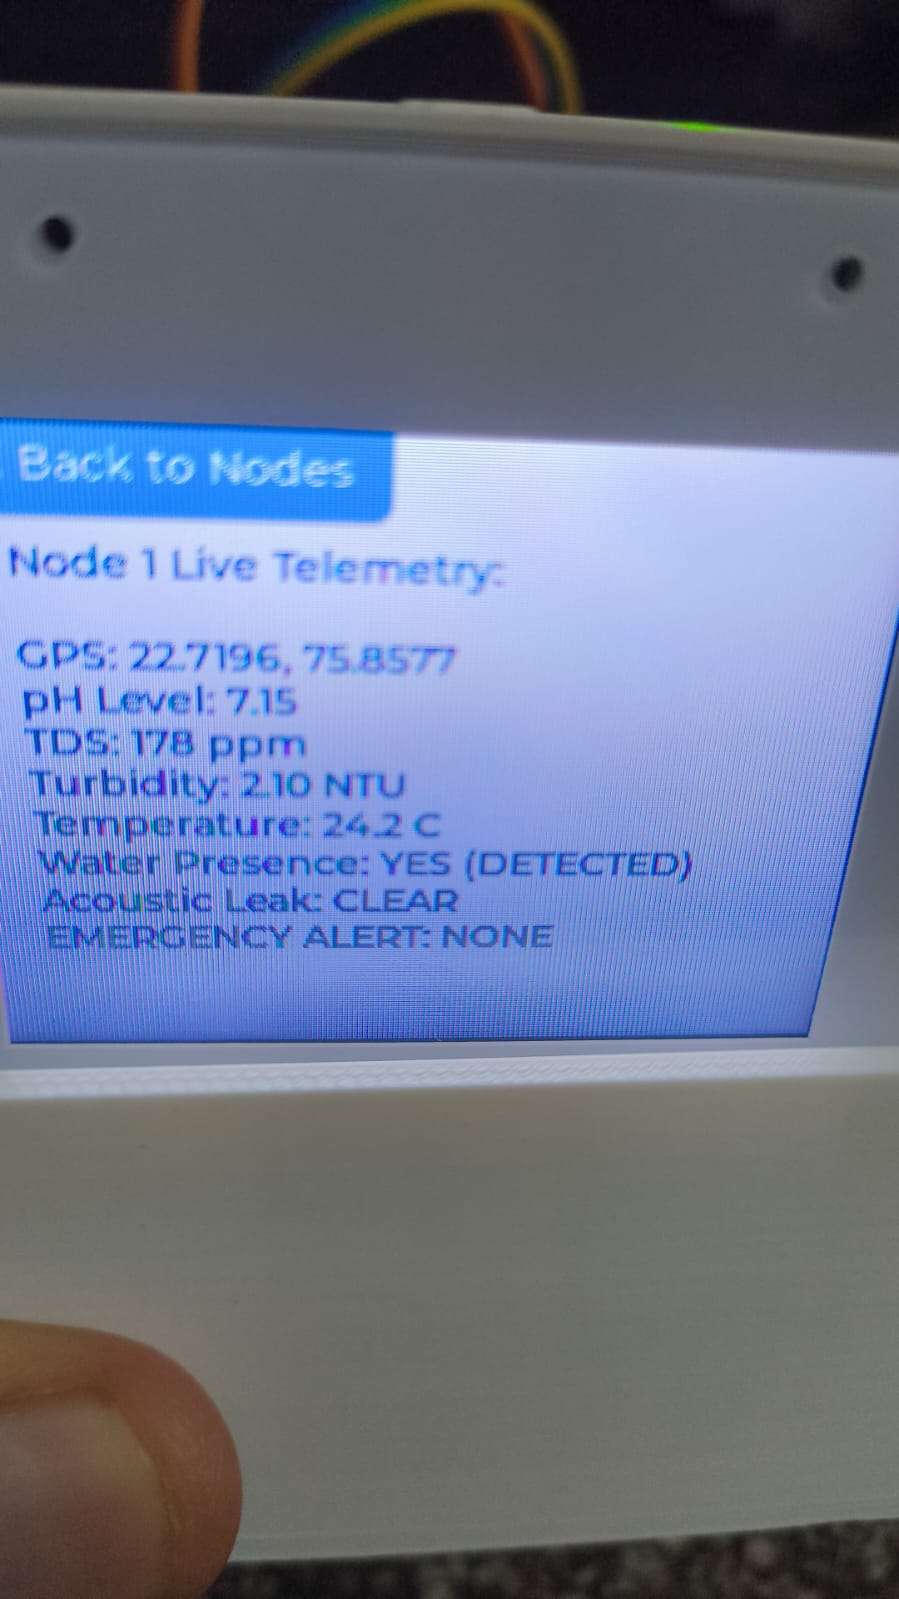
Test 1: Normal Operation (The Baseline)
Scenario: Clean, treated municipal water is allowed to flow through the pipe normally.
Observation: The Pipe Node successfully detects water presence via the GPIO 13 interrupt, bypassing the "dry pipe" sleep state. The analog sensors read a safe pH of ~7.2, low Turbidity (< 5 NTU), and acceptable TDS.
Result: The LoRa payload transmits successfully. The Master Gateway UI displays the data in safe blue text, and the IMC Streamlit Dashboard updates seamlessly, displaying a "Safe" network status. No alarms are triggered.
Water Cup test by Master Gateway of good water have logged in web portal
Cup tested on pure water
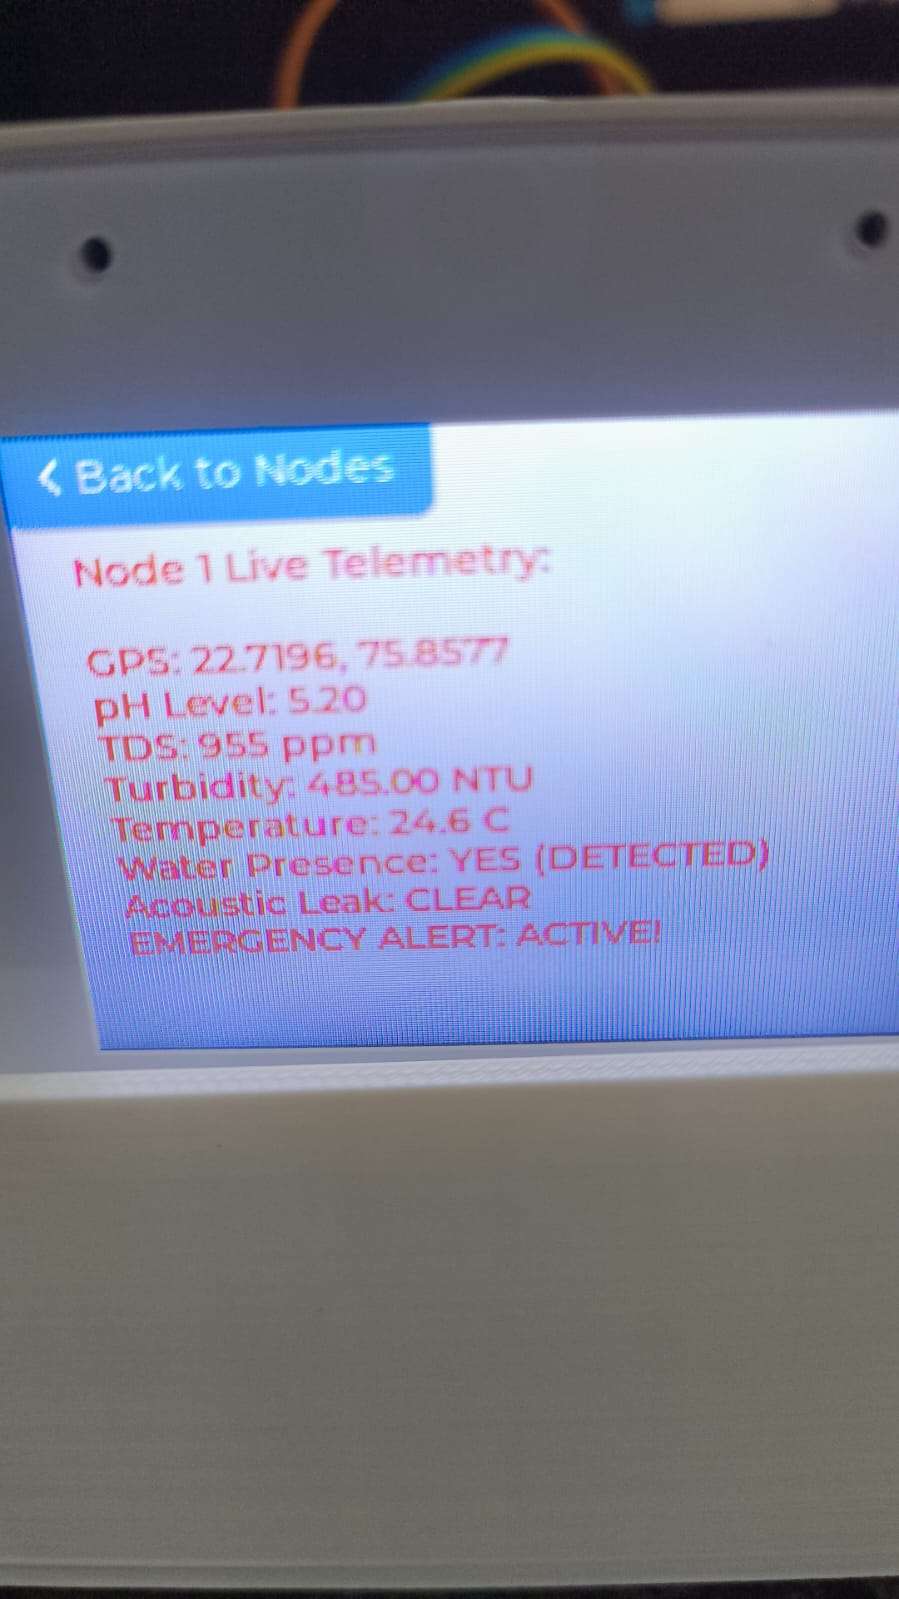
Test 2: The Bhagirathpura Simulation (Sewage Ingress)
Scenario: To simulate the tragic cross-contamination events of January 2026, we injected sevage colected water directly , simulating a scenario where in surrounding raw sewage.
Observation: The exact moment the contaminated water hits the sensor array, the Pipe Node registers an immediate spike in Turbidity (> 400 NTU) and TDS. The Node's Core 1 processor flags this as a critical sewage anomaly (emergencyFlag = true) and fires an emergency LoRa packet.
Result: Within milliseconds, the Master Gateway catches the payload. The physical 3.3V buzzer on the Gateway immediately sounds, the LVGL touchscreen flashes RED with an "ACTIVE ALARM" warning, and the Firebase database updates. The IMC Web Portal simultaneously flashes a critical alert, demonstrating that authorities would be notified before the water ever reached a citizen's tap.
Water Cup test by Master Gateway of Contaminated water have logged in web portal
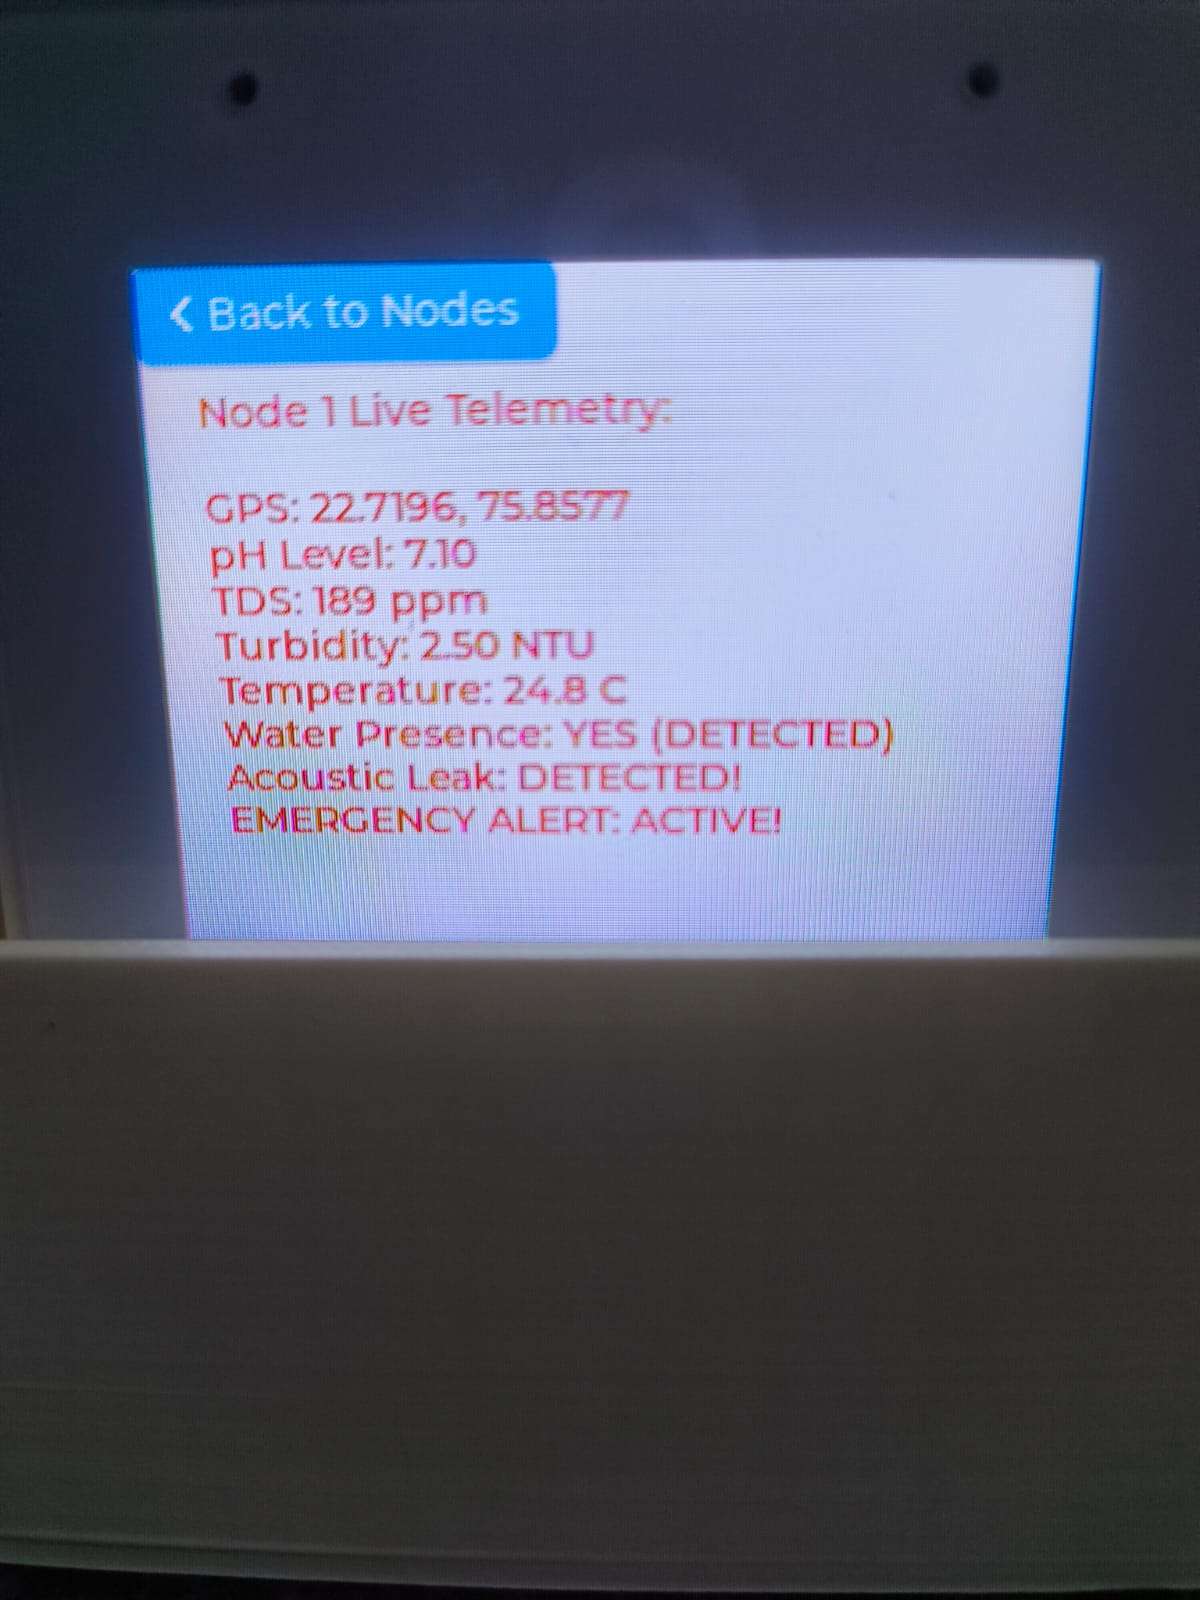
Test 3: The Leak Test (Acoustic AI Validation)
Scenario: did a blast simulation and hit the pipe where microphone module is conected so it will hear the blast sound and gets triggered mimicing the leakage pipeline blast.
Observation: The INMP441 microphone captures the high-frequency hiss/blast of escaping water. The Edge Impulse Neural Network running on Core 0 evaluates the audio buffer and identifies the acoustic signature of a leak with >80% confidence.
Result: The AI core instantly fires the xTaskNotifyGive() command, forcefully waking the sleeping telemetry core. The node transmits the leak flag, successfully triggering the Master Gateway's buzzer and updating the cloud dashboard with an "Acoustic Leak Detected" warning.
(The video demonstrates the complete hardware setup, UI interactions, and live responses to the three simulated tests above).
8. Conclusion: A Safer Future for Indore
The tragic events of January 2026 in Indore proved a painful reality: treating water at a centralized plant is fundamentally insufficient if the miles of aging distribution pipelines remain completely blind to the city above them.
Jal Rakshak provides the missing technological link—continuous, automated, and intelligent vigilance over our critical infrastructure. By moving complex data processing directly to the edge using Machine Learning and utilizing long-range, decentralized LoRa networks, we eliminate the reliance on manual spot checks and delayed citizen complaints.
By implementing this architecture, the Indore Municipal Corporation (IMC) can fundamentally transition from a reactive utility—one that acts only after citizens fall ill or report foul smells—to a proactive, data-driven protector of public health.
My ultimate vision for the ElectronicWings Project Challenge 2026 is to prove that this prototype can be refined into an industrial-grade, scalable solution. With Jal Rakshak deployed beneath our streets, we can ensure that the people of Indore, and cities worldwide, never have to fear the water flowing from their taps again.
.png)
.png)
.png)
.png)
.png)
.png)
.png)
.png)
.png)
.png)
.png)
.png)
.png)
.png)
.png)
.png)
.png)