
An audio spectrum analyzer is an electronic device or software tool that measures and visually displays the frequency spectrum of an audio signal. It shows the different frequencies present in the signal and their respective amplitudes, typically on a graph with frequency on the horizontal axis and amplitude on the vertical axis. In today's video, I will present you with a very simple way to create an audio spectrum analyzer that, despite its simplicity, has many possibilities for adjusting various parameters directly via buttons, without making any changes to the code.
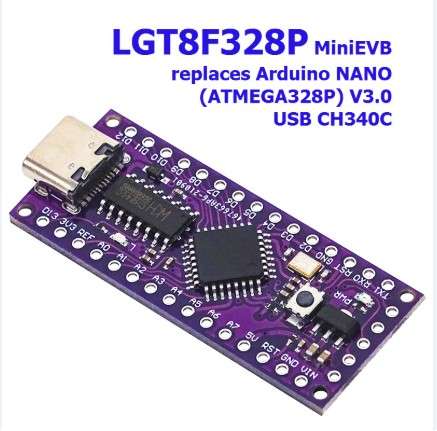
I got the initial idea from a project on the rcl-radio website and decided to expand the original project with more features. The device uses LGT8F328P which is compatible with Arduino Nano 3 and is significantly cheaper but also with better performance.
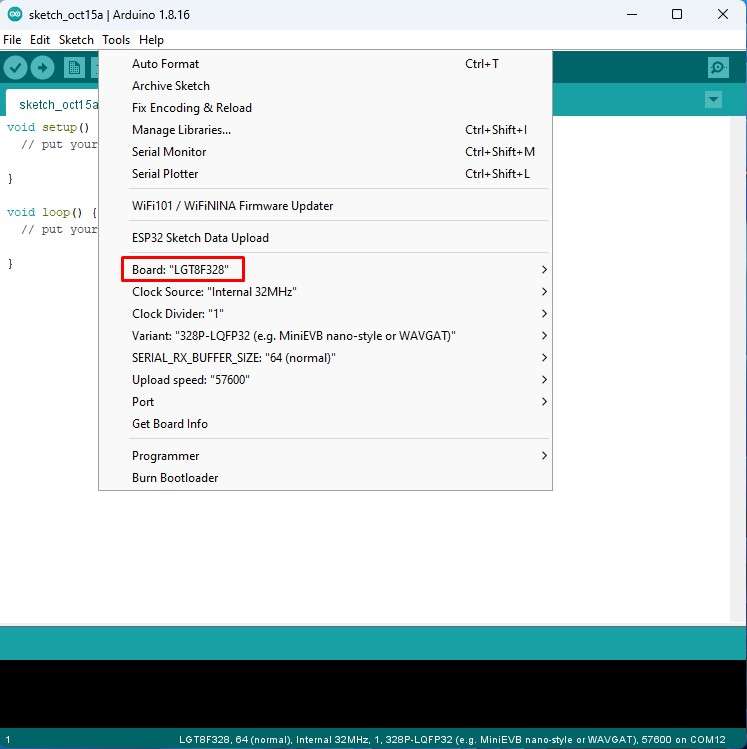
For support in Arduino IDE for LGT8F328P, we need to enter the given link (https://raw.githubusercontent.com/dbuezas/lgt8fx/master/package_lgt8fx_index.json) in File - Preferences - Additional Boards Manager, and then in Tools - Boards Manager we install this microcontroller.
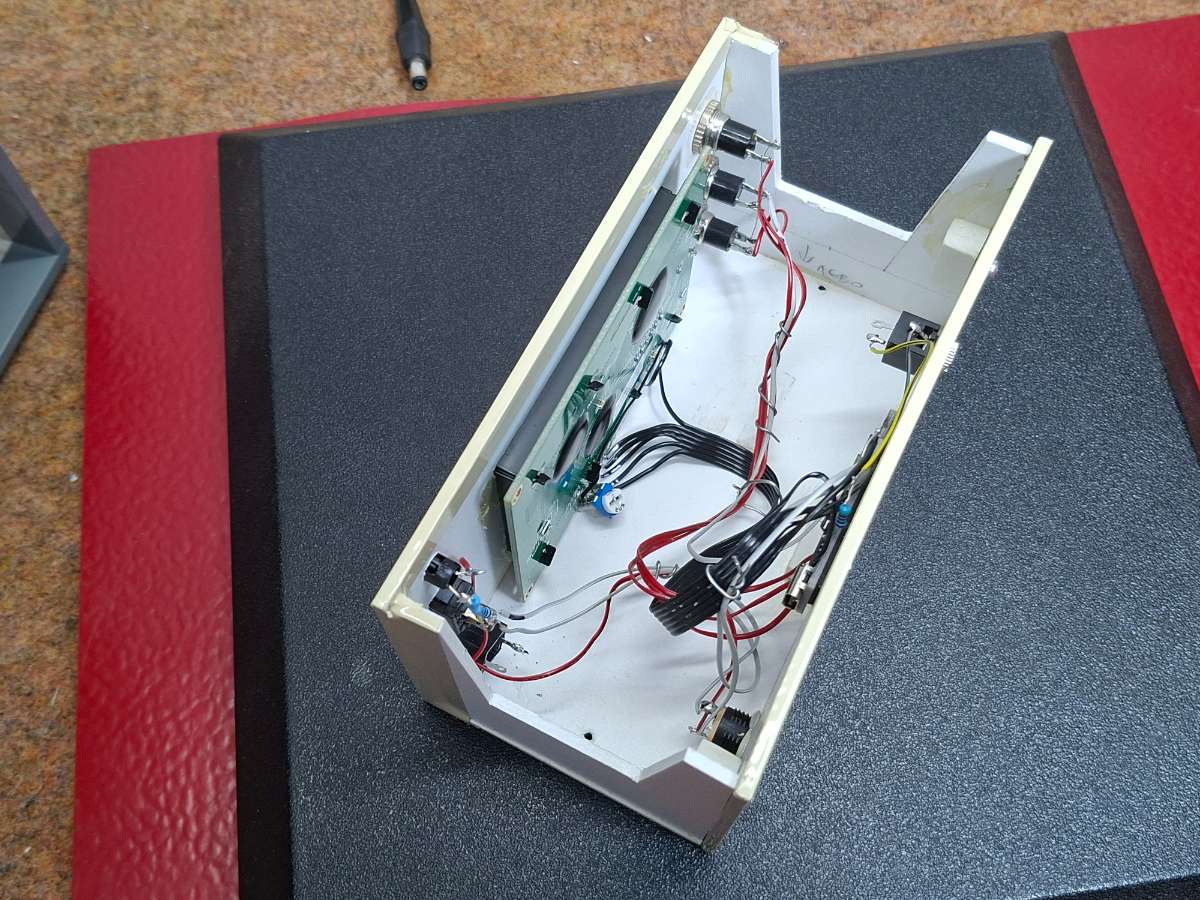
As I mentioned earlier, the device is extremely simple to build and consists of only a few components
- LGT8F328P MCU board
- ST7920 chip LCD display with a resolution of 128X64
- and two resistors
As for the code, it is designed in a way that allows you to easily change many more parameters. For example, The experimental Auto Gain option is very intuitive and works flawlessly, optimally adjusting the bar movements regardless of the input signal strength.
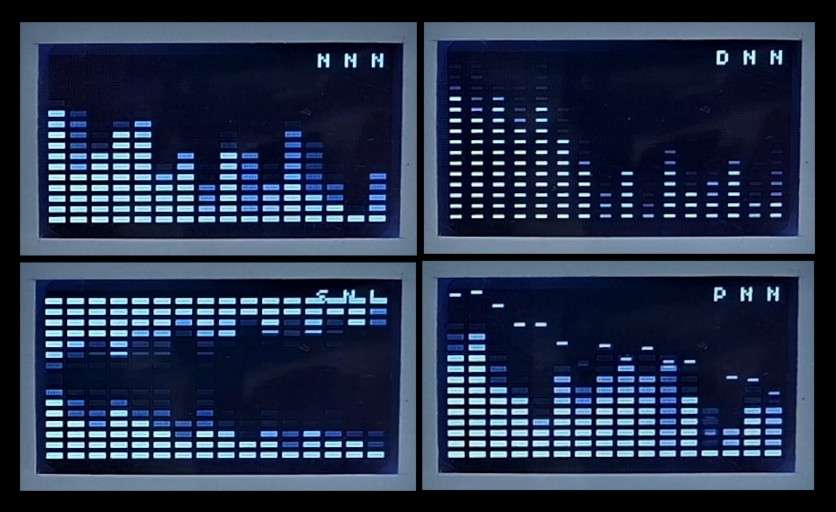
Now let me explain the functions of this spectrum analyzer. When turning on the device, three letters can be seen on the top right of the screen. They sequentially display the current MODE of each button, and are changed by pressing the corresponding button.
- Button 1 cycles through 4 display modes:
Normal: Standard bars
Peak Hold: Bars with peak indicators
Falling Dots: Dot visualization
Mirror: Symmetrical display
- Button 2 cycles through 3 speed modes:
Normal: Standard falling speed
Fast: Quick response
Slow: Slow falling with random elements
- and Button 3 cycles through 3 sensitivity modes:
Normal: Default gain
High: More sensitive (lower gain)
Low: Less sensitive (higher gain)
And finally a short conclusion. This project showcases a simple yet versatile audio spectrum analyzer built with the LGT8F328P microcontroller, offering multiple adjustable display, speed, and sensitivity modes for a customizable audio visualization experience.