
NaadNet — IoT Noise Pollution Monitoring Network
Real-time urban noise surveillance with ESP32 edge nodes, TinyML classification, GIS spatial interpolation, and an AI-powered forecasting dashboard.
The Problem Find
Urban noise pollution is an invisible public health crisis. WHO guidelines recommend ambient noise below 55 dB for residential areas and 65 dB for commercial zones, yet most cities have no continuous, spatially-aware monitoring infrastructure. Traffic, construction, and crowd noise routinely exceed safe limits, causing sleep disorders, cardiovascular stress, and reduced cognitive function — yet city planners are largely flying blind.
Existing solutions are either too expensive, too sparse (one or two fixed stations per city), or too slow (weekly manual readings). There is no affordable, scalable, real-time system that can tell you
- where the noise is
- how bad it is right now
- what is causing it
- and what it will be in the next hour
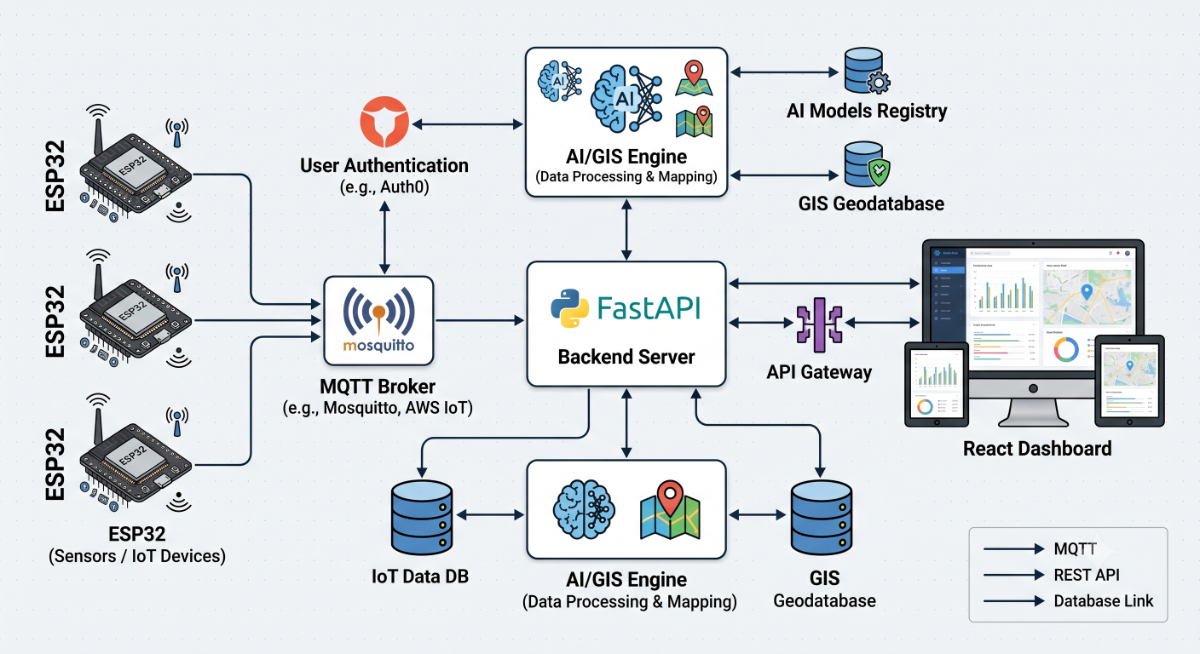
NaadNet solves this by deploying a mesh of low-cost ESP32 sensor nodes across a city, streaming live dB readings via MQTT, and running an AI/GIS backend that produces real-time noise heatmaps, anomaly alerts, hotspot predictions, and time-series forecasts — all visualised on a web dashboard accessible from any browser.
Project Overview
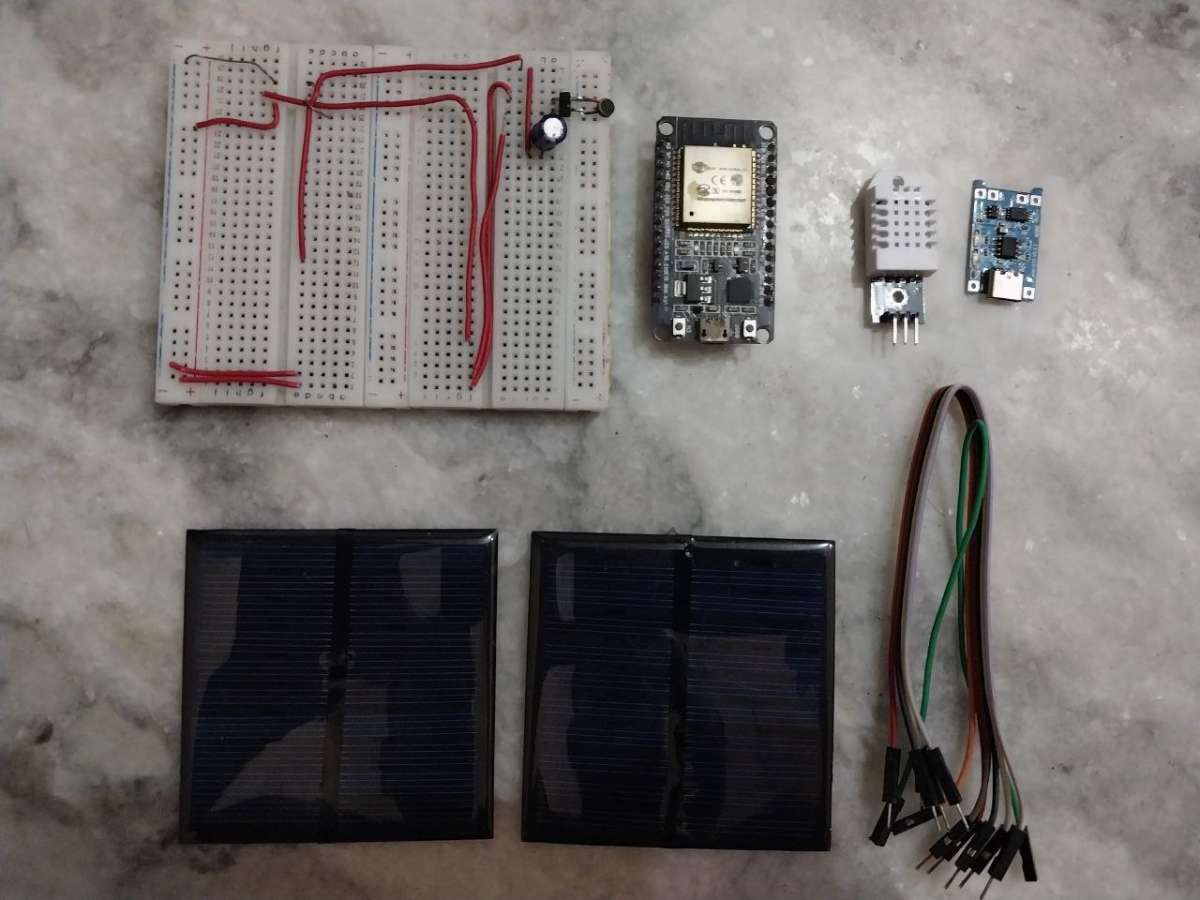
Hardware:
| Component | Qty |
| ESP32 Dev Board (ESP-WROOM-32) | 1 |
| MAX9814 Electret Mic Amplifier | 1 |
| DHT11 Temperature & Humidity Sensor | 1 |
| 1000 µF electrolytic capacitor (power filtering) | 1 |
| 10 kΩ resistor (pull-up) | 1 |
| LiPo battery 3.7 V / 2000 mAh (optional) | 1 |
| AMS1117 3.3 V regulator (optional) | 1 |
| Mini Solar Pannel | 2 |
| Weatherproof ABS enclosure | 1 |
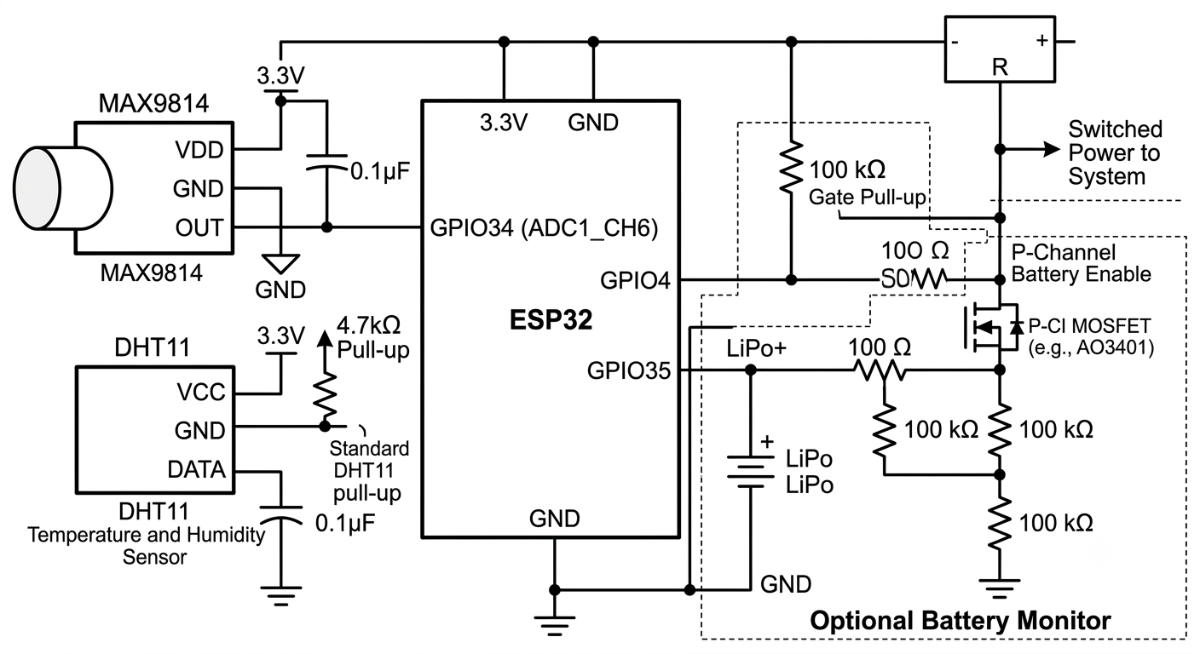
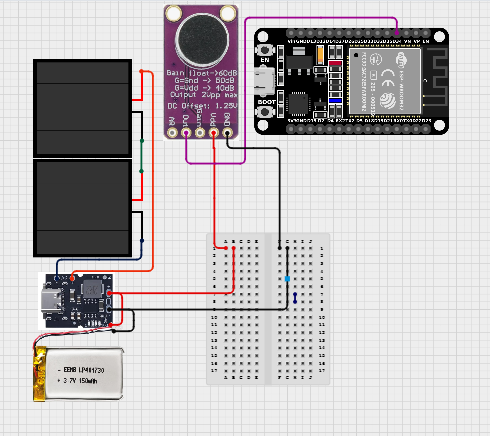
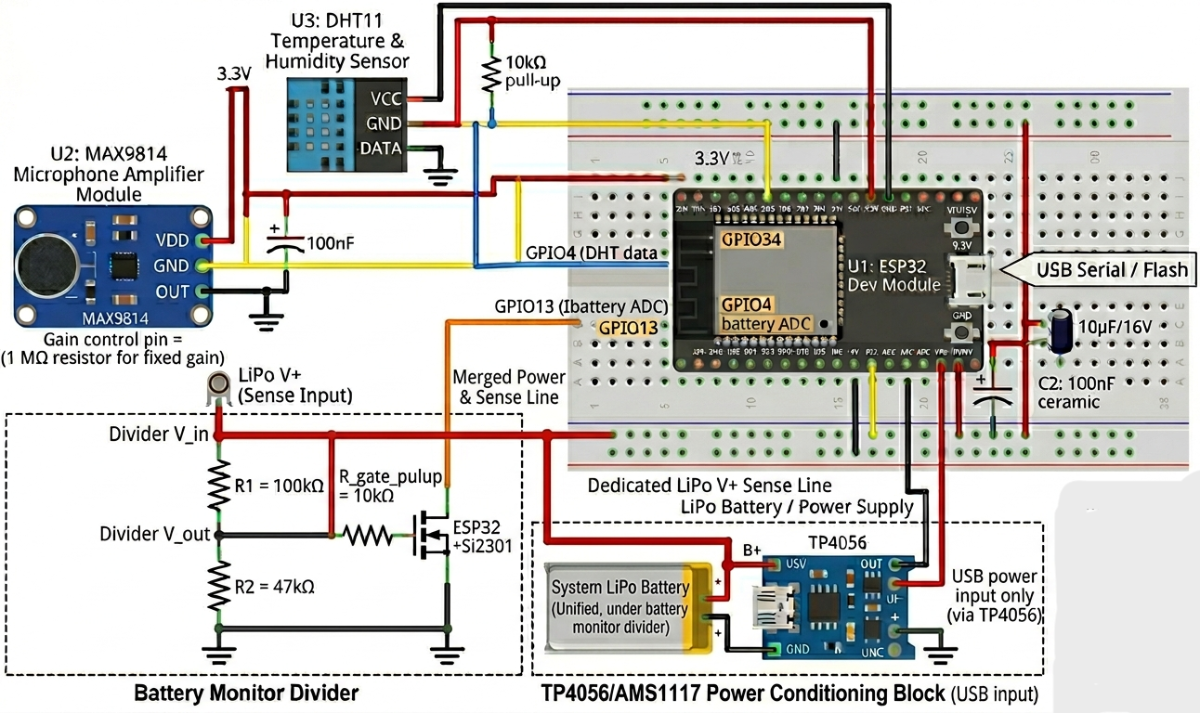
Wiring Diagram:
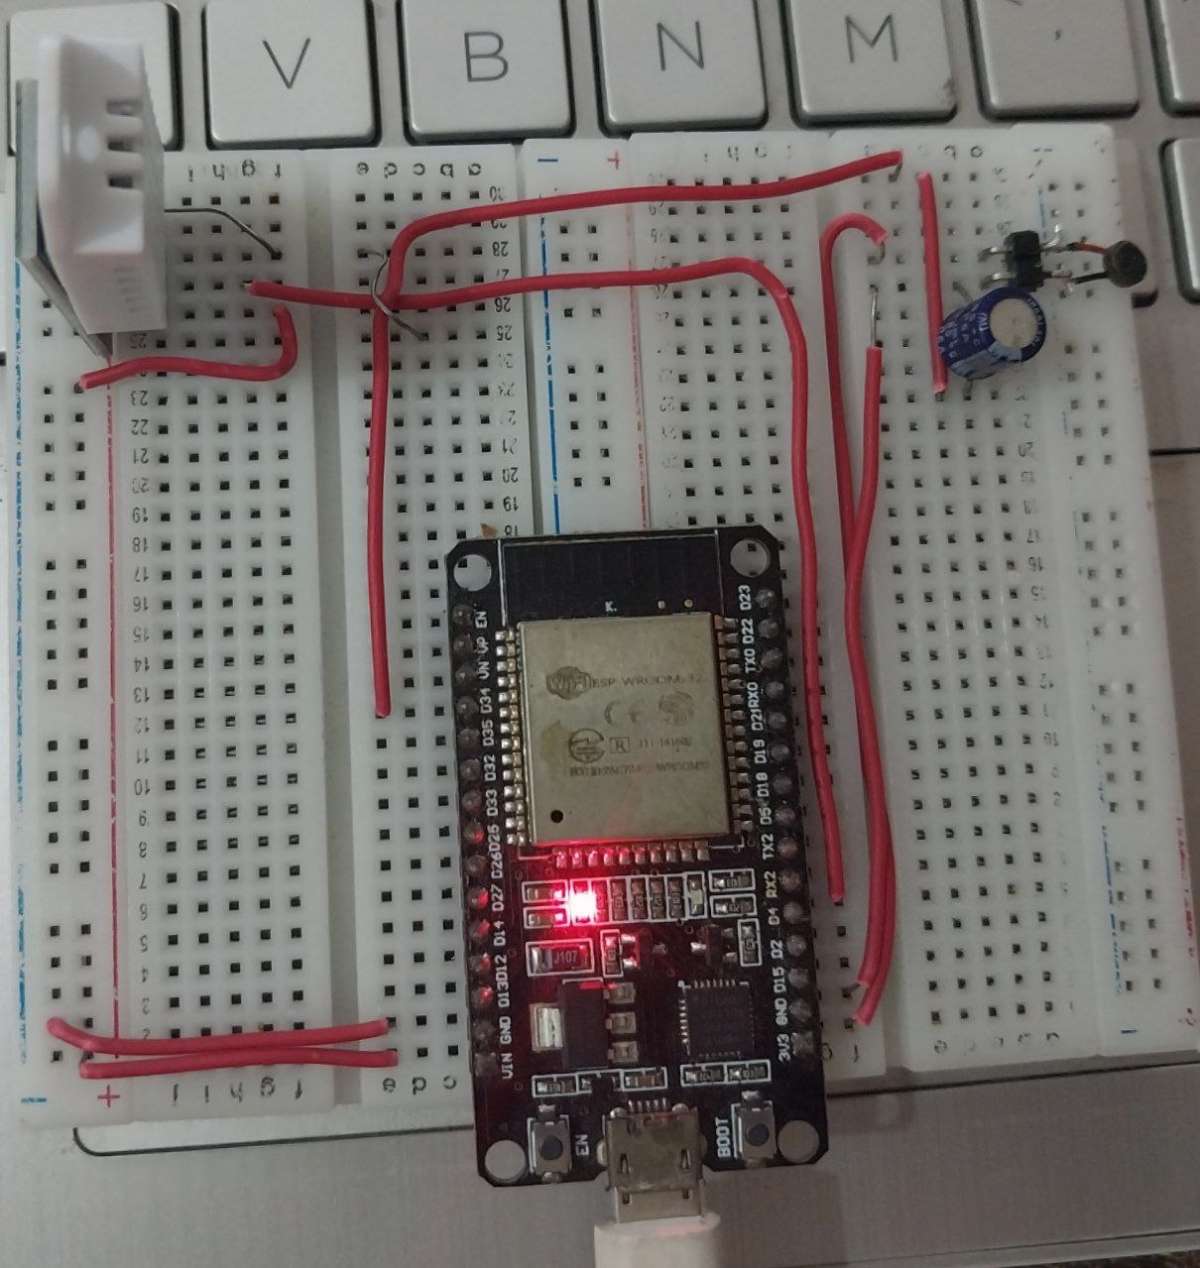
Step 2: Wire the MAX9814 Microphone (Mic)
Solder short jumper wires between the ESP32 and MAX9814 module following the wiring diagram above. The OUT pin connects to GPIO34 — make sure to use an ADC1 pin (not ADC2, which conflicts with WiFi).
Add a 1000 µF capacitor between 3.3 V and GND close to the MAX9814 to suppress power supply noise that would otherwise appear as low-frequency dB readings.
Pin Reference
| ESP32 | MAX9814 (Mic) |
| 3.3V | VDD |
| GND | GND |
| GPIO34 | OUT |
Step 3: Wire the DHT11 Sensor
Connect DHT11 DATA to GPIO4. Place a 10 kΩ pull-up resistor between the DATA pin and 3.3 V. The DHT11 reports temperature (±2 °C) and humidity (±5 %RH) which are logged alongside the noise data and displayed in the dashboard heatmap.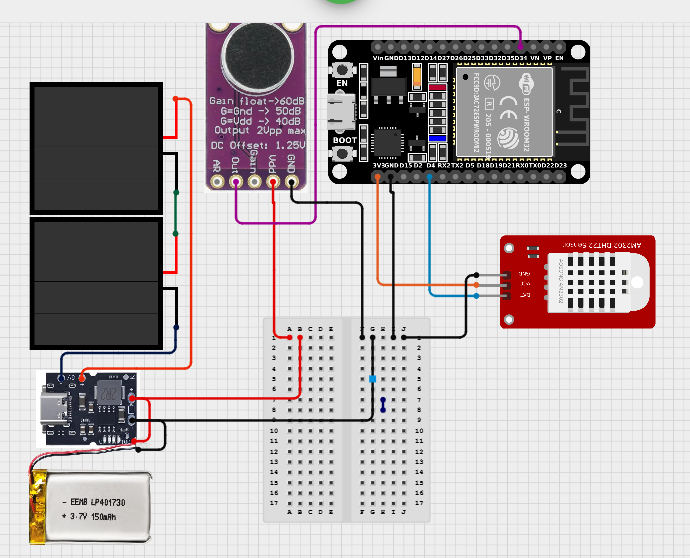
Connection of DHT11 Temperature & Humidity
| ESP32 Pin | DHT11 Pin |
| 3.3V | VCC |
| GND | GND |
| GPIO4 | DATA |
Optional battery monitor:
GPIO35 ── 100 kΩ ── LiPo+ ── 100 kΩ ── GND (voltage divider)
GPIO13 ── MOSFET gate (battery enable switch)
How the Node Measures Noise
1. Sampling: The ESP32 ADC samples the MAX9814 output every 100 ms, collecting a 50-sample window (5 seconds of data) for each reading cycle.
2. RMS Calculation: The raw ADC values are converted to voltage, then RMS voltage is computed across the window.
3. dB SPL: Using the MAX9814 sensitivity spec (6 mV/Pa), the RMS voltage is converted to Pascals and then to decibels: `dB = 20 × log10(Pa / 20µPa)`.
4. Peak dB: The maximum single-sample value in the window is also tracked and reported.
5. FFT + TinyML: Every 5th cycle, a 256-point FFT is computed over the raw ADC buffer. Four spectral bands (Low, Mid-Low, Mid-High, High) are fed into the on-device TinyML classifier to identify the probable noise source (traffic, crowd, construction, ambient).
6. MQTT Publish: A JSON payload containing `node_id`, `noise_db`, `peak_db`, `temperature`, `humidity`, `battery_mv`, `noise_source`, and `confidence` is published to `naadnet/{node_id}/noise`.
Step-by-Step Hardware Assembly
Step 1: Prepare the ESP32 Board: Open Arduino IDE
.png)
Step 2: Open cmd
.png)
Step 3: Run ipconfig
.png)
Step 4: Configure Node Identity
Edit `firmware/esp32_node/include/config.h` or `firmware/esp32_node/data/config.json` with the node's coordinates, WiFi credentials, and MQTT broker address:
#define WIFI_SSID "YourWiFi"
#define WIFI_PASSWORD "YourPassword"
#define MQTT_BROKER "192.000.0.000" // pest IP Address
#define NODE_ID "HTC-01" // Change every Esp
#define NODE_LABEL "Hitech City"
#define NODE_LAT 17.3850f
#define NODE_LNG 78.4860f
#define NOISE_THRESHOLD 70
- Each node in the network needs a unique `NODE_ID`. The naming convention used in Hyderabad deployment is `{AREA_CODE}-{INDEX}` (e.g., `HTC-01`, `KKP-02`, `SEC-04`).
.png)
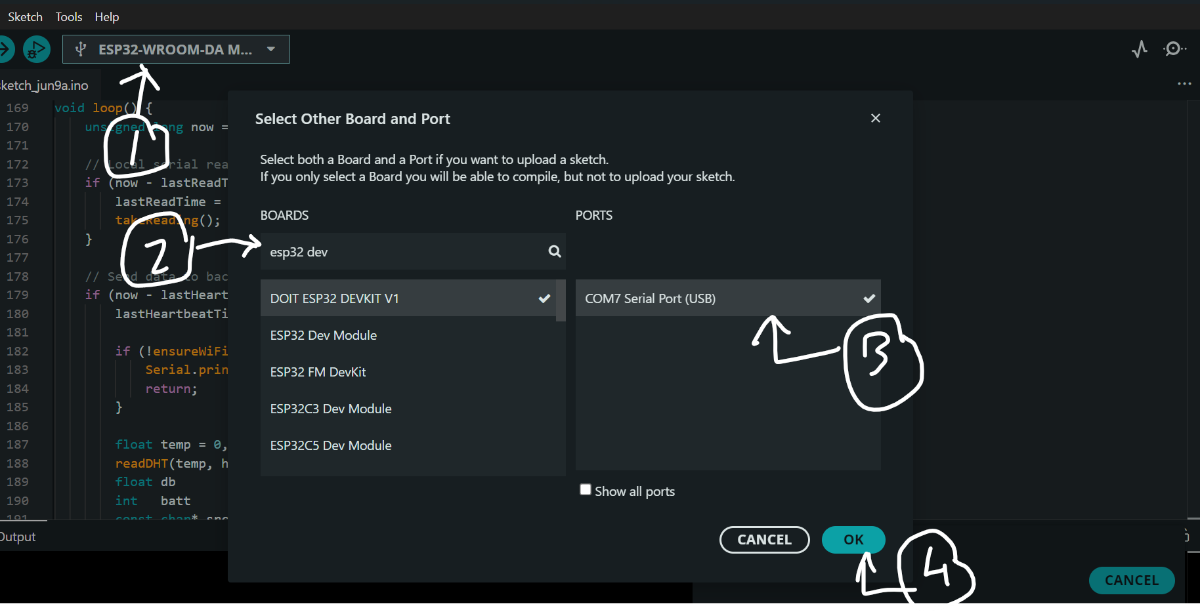
Step 5: Select the Board
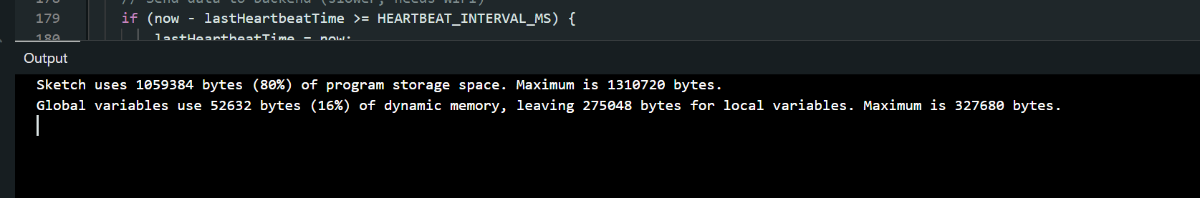
Step 6: Verify & Upload
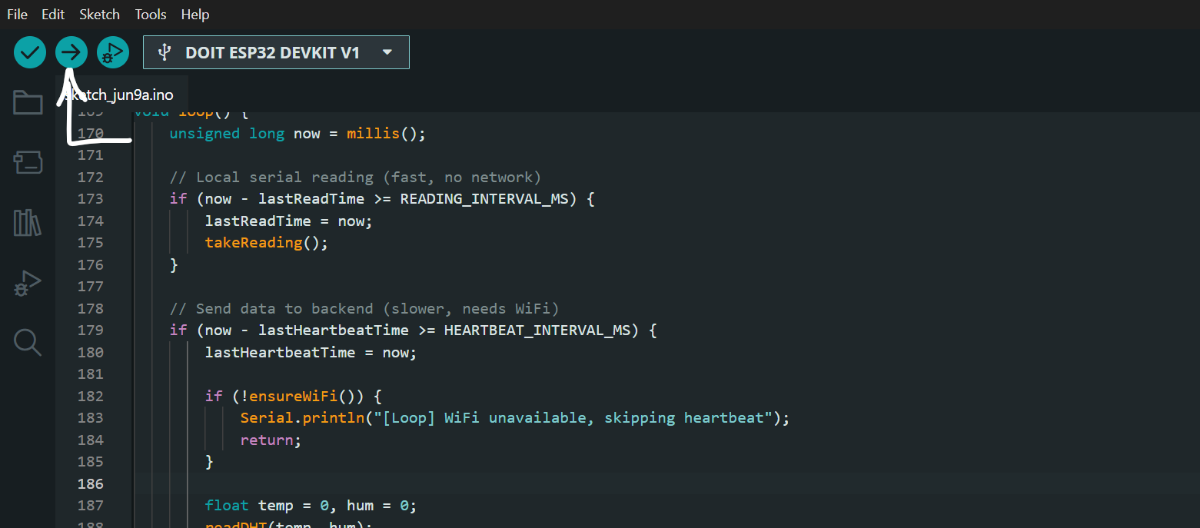
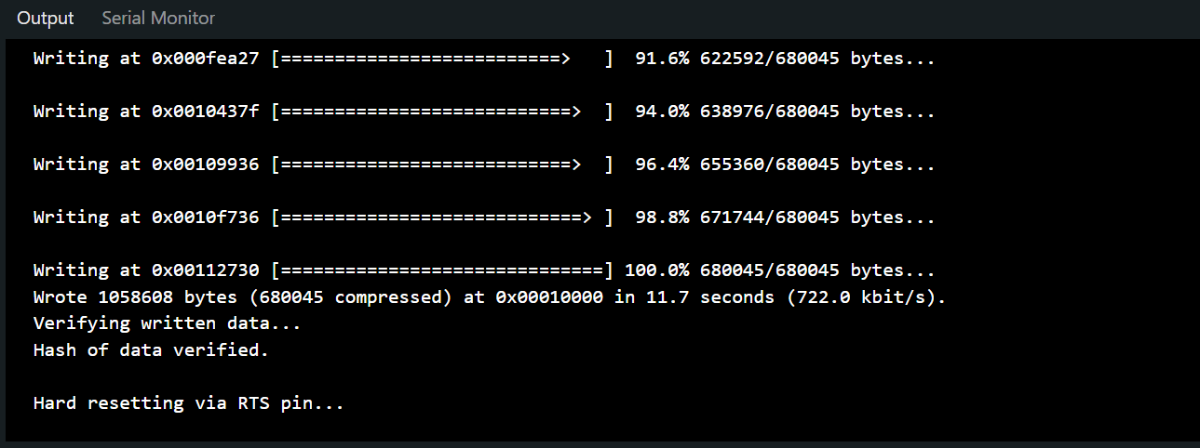
Step 7: Done Uploading (Ready To use )
Step 8:
Public Pages
Dashboard (Home)
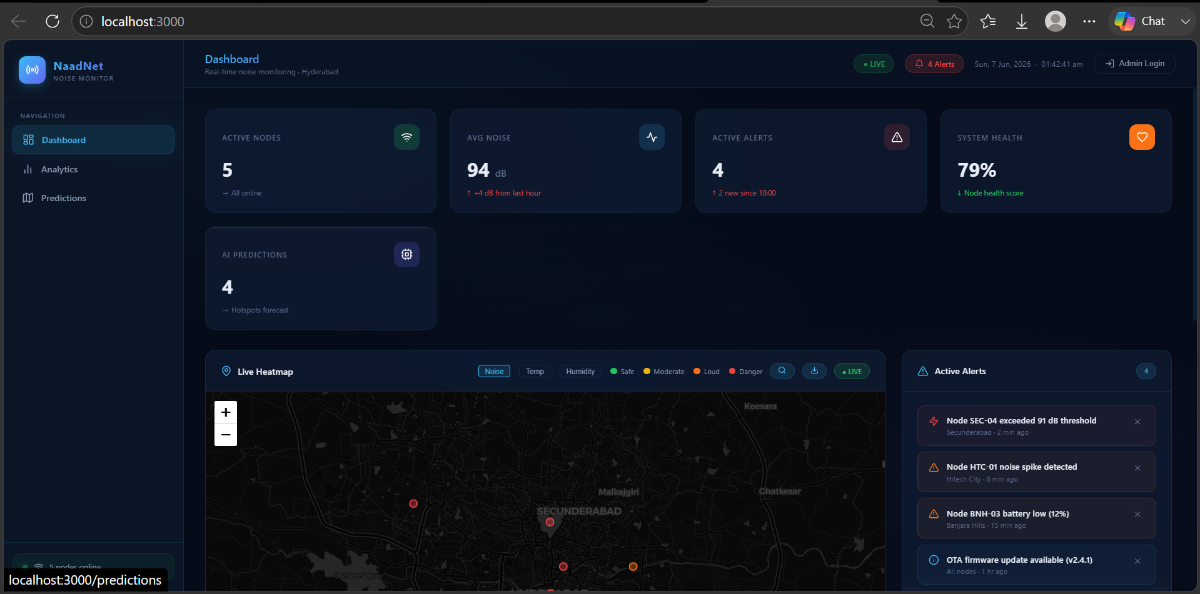
The main page shows:
- 5 stats cards: Active Nodes, Average Noise (dB), Active Alerts, System Health %, AI Predictions count
- Live Heatmap: Leaflet map with Kriging interpolation, switchable between Noise / Temperature / Humidity views. Supports location search (Nominatim) and direct lat/lng navigation.
- Timeline Playback: Drag a slider to replay historical noise data hour-by-hour.
- Alert Panel: Live feed of threshold breaches, anomaly events, and system notifications.
- Node Status List: Per-node cards showing ID, location, current dB, status badge, temperature, humidity, and battery level.
Analytics
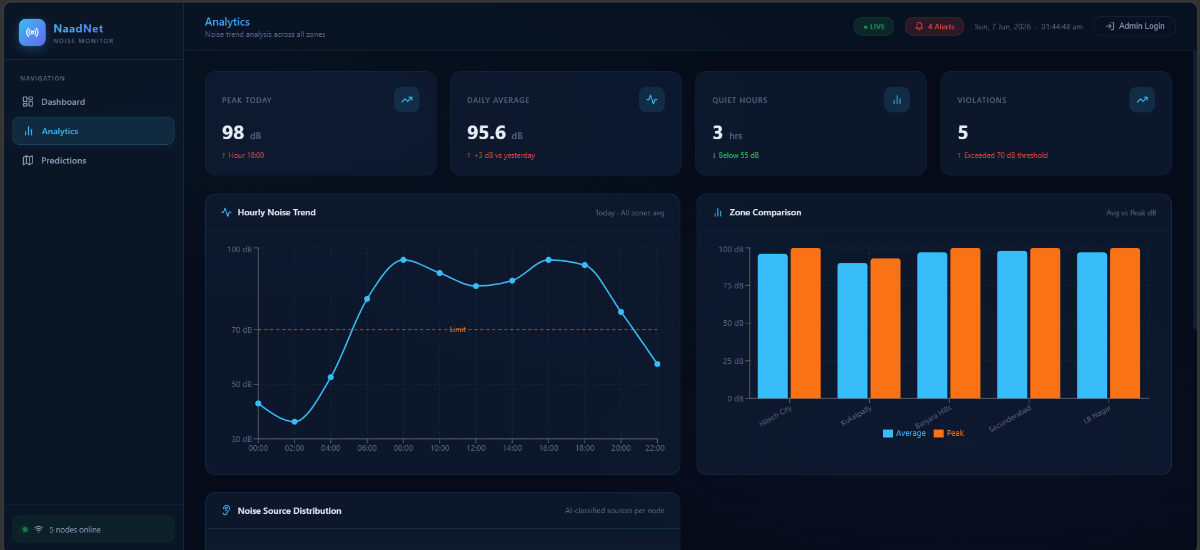
- Hourly noise trend (24-hour bar chart)
- Zone-by-zone average vs. peak comparison
- Per-node health scores (computed from noise level, battery, uptime, anomaly frequency)
- Peak hour identification
- Quiet hours count (hours below 55 dB)
Predictions
.png)
- Short-horizon forecasts: next 10 minutes, 1 hour, 24 hours
- Hotspot risk map with DBSCAN cluster boundaries
- Per-node multi-step forecast chart (40-minute lookahead)
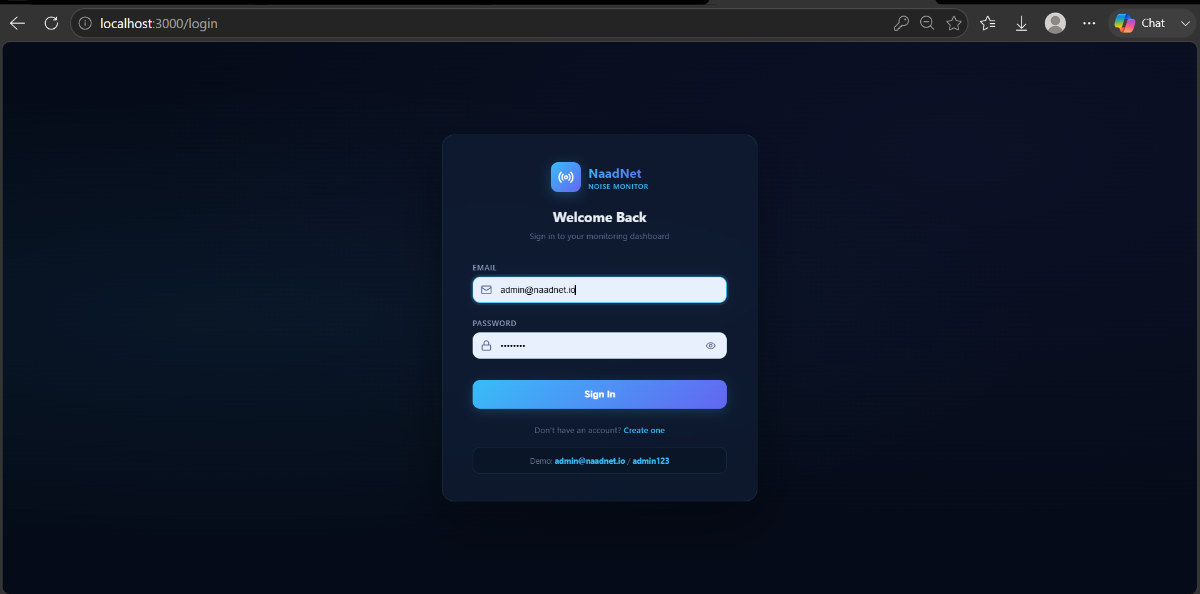
Admin Pages (Login Required)
Map Manager
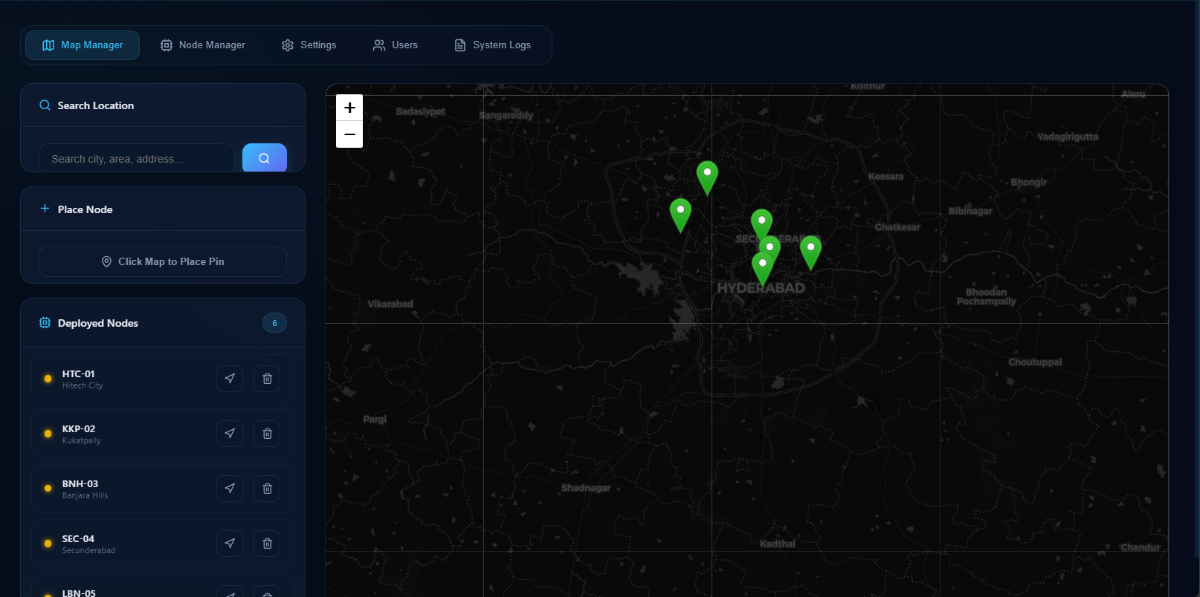
Add, move, or remove sensor nodes directly on the map. Click anywhere to drop a new node pin, fill in the ID and label, and save — the node immediately starts simulating data.
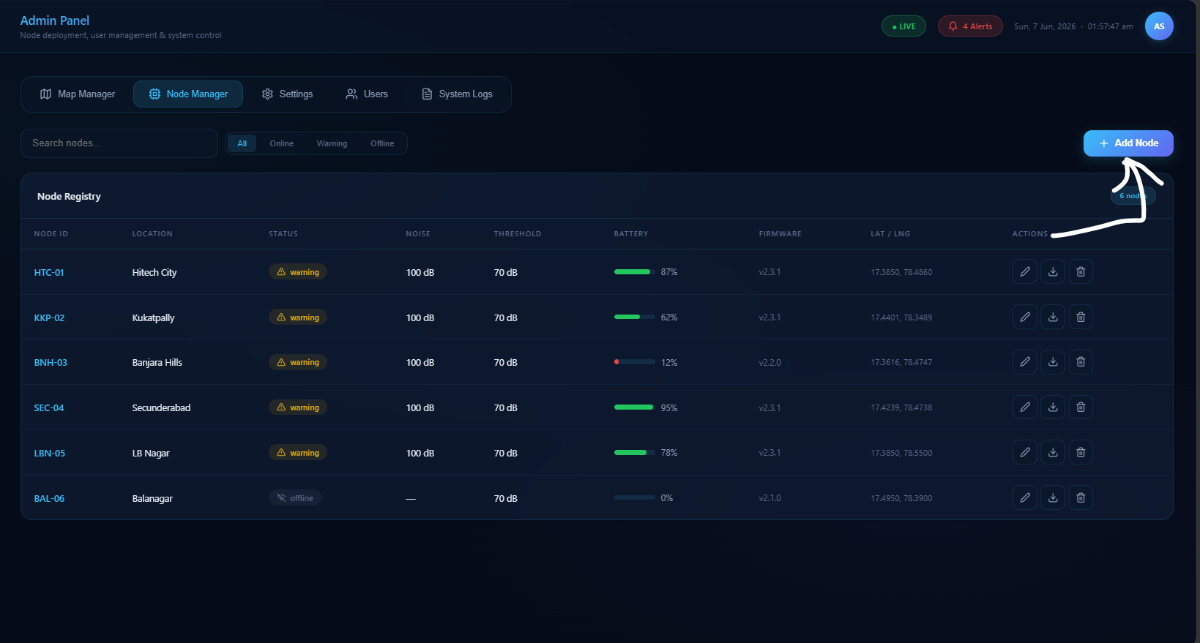
Node Manager
.png)
Table view of all nodes with inline editing. Update firmware version, noise threshold, and node label. Delete nodes that have been decommissioned.
Settings
.png)
Configure MQTT broker address and port, global noise thresholds, notification channels (email/webhook), and data retention period.
Users
.png)
Create and manage user accounts with role-based access: `superadmin`, `admin`, `viewer`.
System Logs
.png)
Full audit trail of all API actions (node created/deleted, user login, retrain triggered, threshold breached) with timestamp, severity, and source node.
Manual Setup
Step 1. Open link : Click
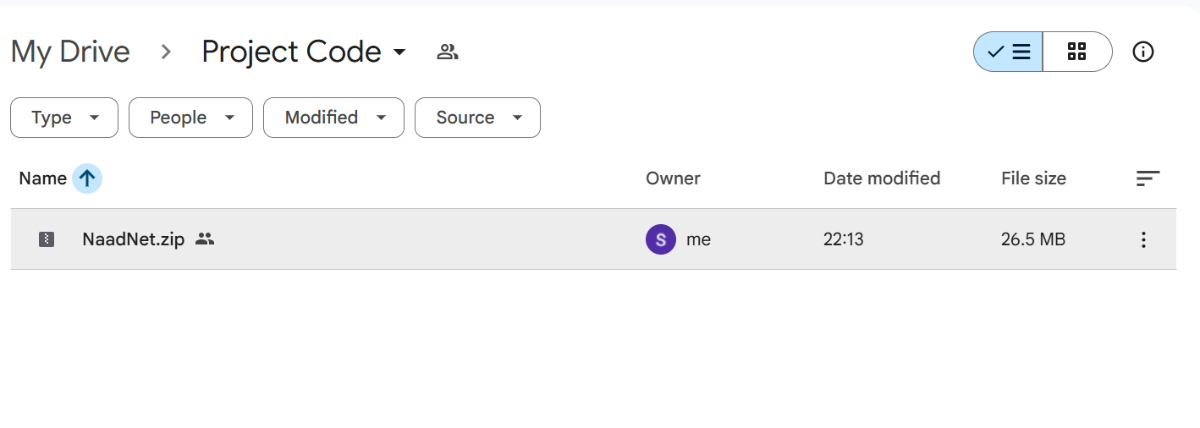
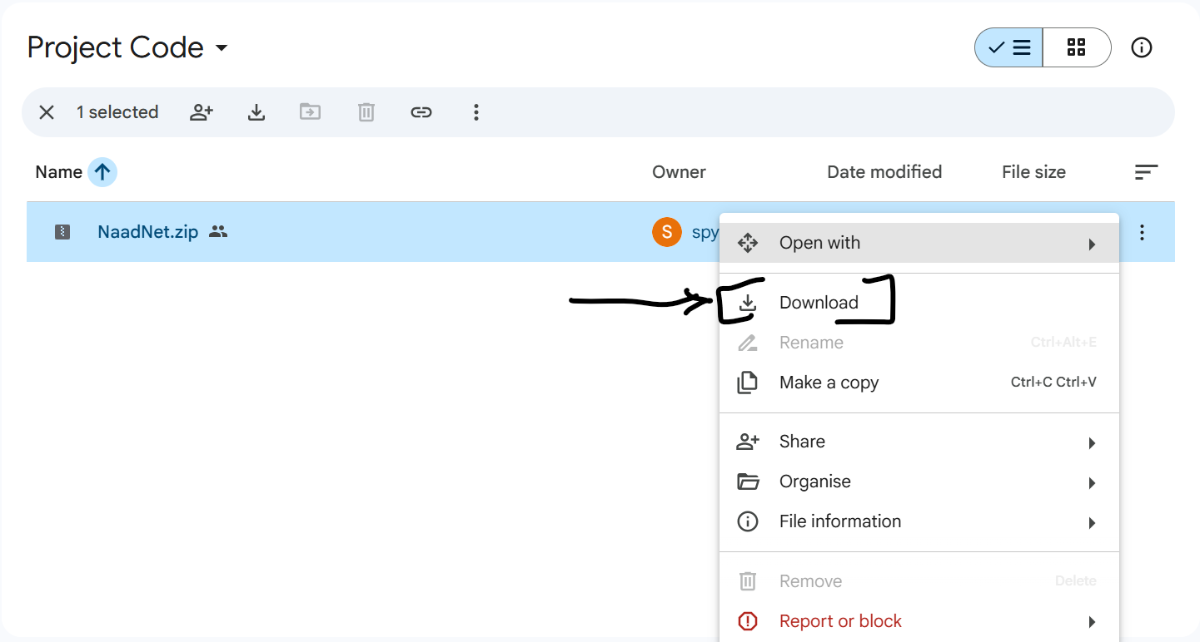
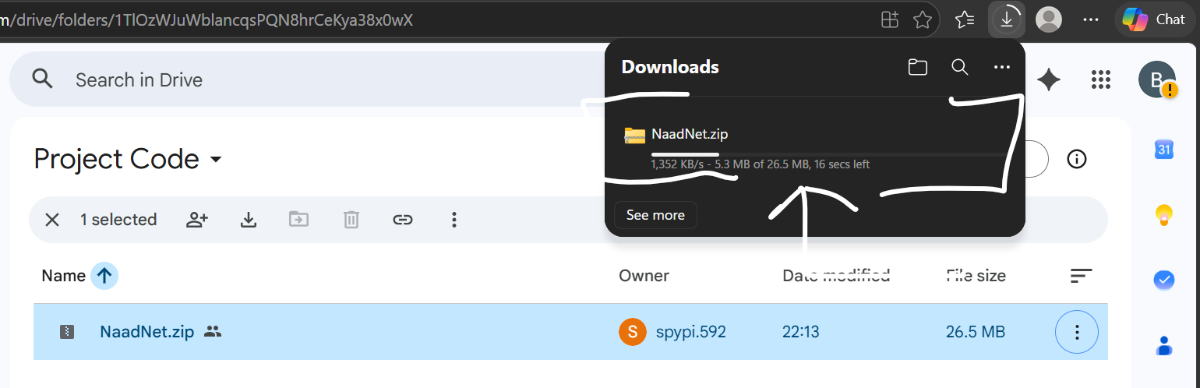
Step 2. Download Project Code
Step 3. Unzip the Folder
.png)
Step 4. Open on vs code/ Kiro
.png)
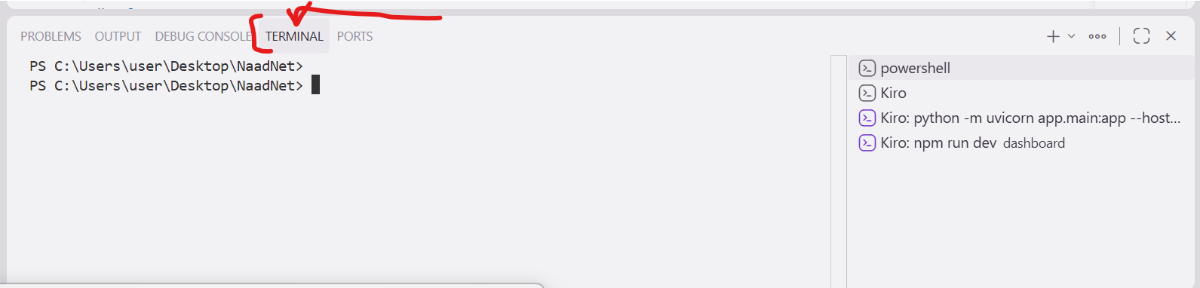
Step 5: Open Terminal
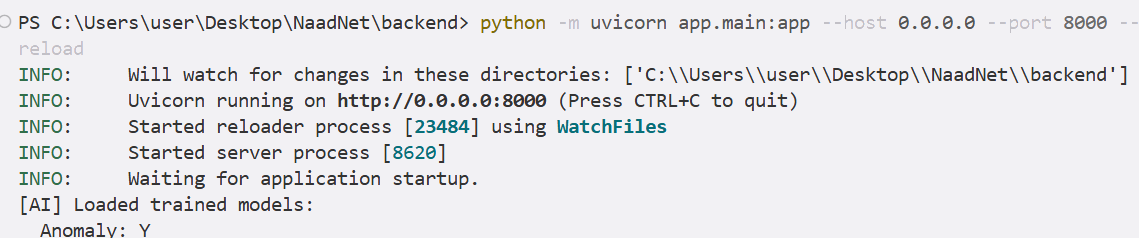
Step 6. Run the Backend (in terminal)
1. Backend
Run in Terminal:
- pip install -r backend/requirements.txt
- python backend/training/train_models.py # generates initial models
- python -m uvicorn backend.app.main:app --host 0.0.0.0 --port 8000
3. Dashboard
Run in Terminal:
- cd dashboard
- npm install
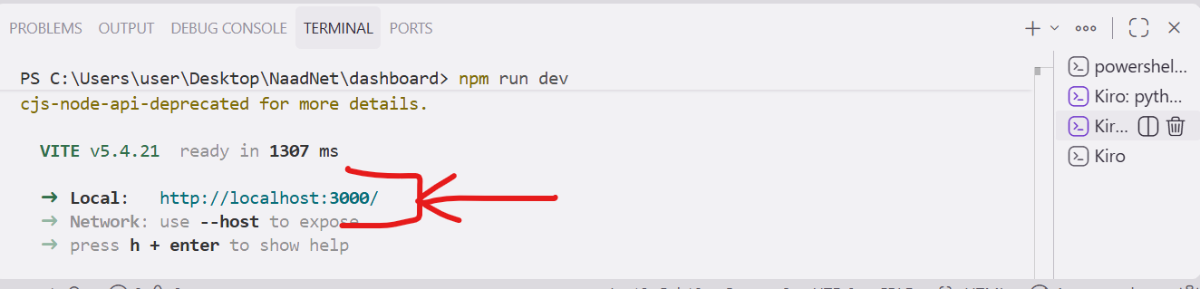
- npm run dev
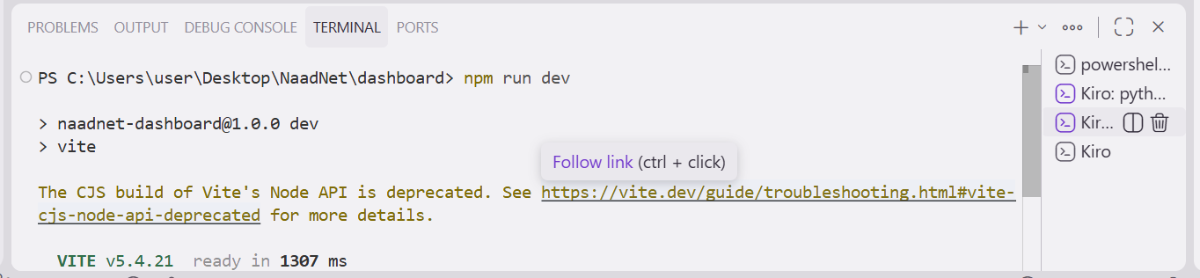
- Click Local:
Add New Node:
Fill the details:
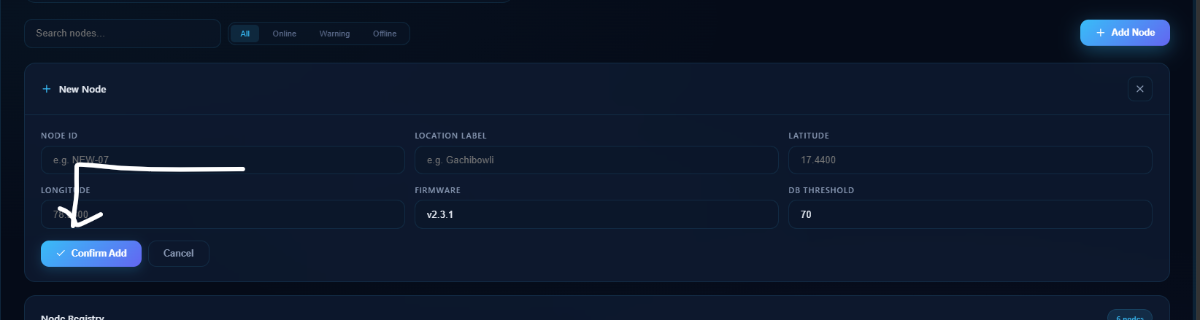
Confirm Add
Need Help: Google Form
License
MIT License. See [LICENSE](LICENSE) for details.