Our Pulse oximeter is a gadget that works on the pulse oximetry concept. Pulse oximetry is a technique for measuring people's oxygen saturation (SpO2) without causing damage to their bodies. The normal level of SpO2 is between 95 and 100 percent. The level of SpO2 is mostly determined by the R (ratio) value. The R value is the ratio of red and infrared light. Red has a wavelength of 660nm, whereas IR (infrared) has a wavelength of 940nm. The pulse oximeter determines whether or not a person's blood oxygen level is within a healthy range. Hypoxemia occurs when your oxygen level falls below the usual range.
1.1 Problem Description:
The objective of this study through our project was to develop determine whether a machine learning predictive model could be trained on a set of clinical data and weather will it can be used to predict transcutaneous hemoglobin oxygen( Sp02) level of a patient and by judging all the acquired values predict and show the levels for the past days.
1.2 Issues and Challenges:
- Calibration and filtering of data asper different categories of health conditions: Couple of initial of data for BPM measure were error so had to be neglected by the MCU itself .
- Sensor error : Although the sensor accuracy wasn't very high but was good enough to get health conditions and obtain logs for analysis. The sensor precision in case of Pulse rate was an issue and really challenging to be made stable.
- I2C Address determination : The I2C address specially for OLED wasn’t well documented mainly as it had many variants and ours was purchased from the local market . Therefore a special c++ program had to be run connecting the I2C device through the bus of the mcu.
- I2C pull configuration : The I2C pull up for the two devices was very well configured and therefore had to be configured in custom to make communication more stable at the device logic level .
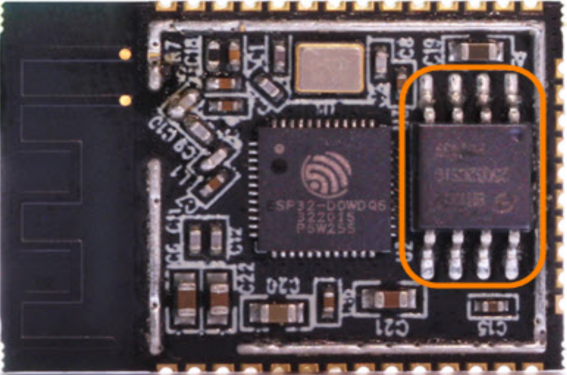
The regular available module of Max30100 had the I2C pull-up resistors connected to the onboard LDO of 1.8V which made it difficult to establish communication with general MCUs having logic voltage level above 1.8V (3.3 in Esp32) to fix this communication problem the 4.7k resistors’ copper track on the PCB , connected to 1.8V LDO had to be etched and soldered to the output terminal of the 3.3V LDO . As shown in the figure below .
- Exporting SPO2 and BPM data for ML data analysis in Python : Although data could be logged and saved in csv using UART serial communication of PuTTY terminal as well as the Blynk cloud but a perfect format to simply analyze data from csv couldn’t to attained . Hence some filtering , dividing of data had to be done using python tools itself .
PROJECT COMPONENTS
_________________________________________________
This chapter basically provides the background information regarding the components which we are using in our project. Starting with IoT network Protocols we have :
2.1 IoT Protocols :
WiFi 802.11 b/g/n :
IEEE 802.11 is a set of MAC and PHY protocols for establishing WLAN computer communication and is part of the IEEE 802 series of LAN technical standards. The standard and amendments form the foundation for wifi-branded wireless network equipment and are the most extensively utilised wireless computer networking protocols in the world. Esp32 runs WiFi at 2.4GHz giving it compatibility with all WiFi bands of standard b, g and n .
HTTP :
Hypertext Transfer Protocol (HTTP) is the application layer of TCP Internet Protocol for transmission of hypermedia documents such as HTML . Designed mainly for communication between server and browsers but works for other applications as well . This protocol works on server - client concept working with request and response .
2.2 IOT SOC Dev. Board :
Wifi, BLE, and Lora modules for IoT are divided into two categories:
- In a single chip, the MCU executes both the IoT network stack and the host application.
- A host processor + IOT module solution in which the wifi stack is contained in the wireless connectivity solution and the host application is operated by a separate processor.
ESP32:
Espressif Systems designed the ESP32 SOC chip. This SOC supports embedded devices with WiFi dual mode Bluetooth connection. Tensilica Xtensa LX6 microprocessors with a dual-core variant and a clock rate of over 240 MHz are used in the ESP32 chip.The soc features 2 I2C controllers and multi ADC on Gpios as well . The development board of Esp32 is based on Esp wroom 32 dev module which comes with a on module 4mb flash .
MCU Communication:
A multipoint Control Unit (MCU) is a device that is frequently used to connect video conferencing systems. The multipoint control unit is a LAN endpoint that allows three or more terminals and gateways to join a multipoint conference. A necessary multipoint controller (MC) plus an optional multipoint processor make up the MCU (MPs).
I2C Communication Protocol:
Inter-Integrated Circuit is the abbreviation for Inter-Integrated Circuit. It's a serial communication bus interface connection protocol that's built into devices. Philips Semiconductor created it in 1982. It has recently become popular for short-distance communication. Two Wired Interface is another name for it (TWI). There are two types of operation for I2C: master and slave.
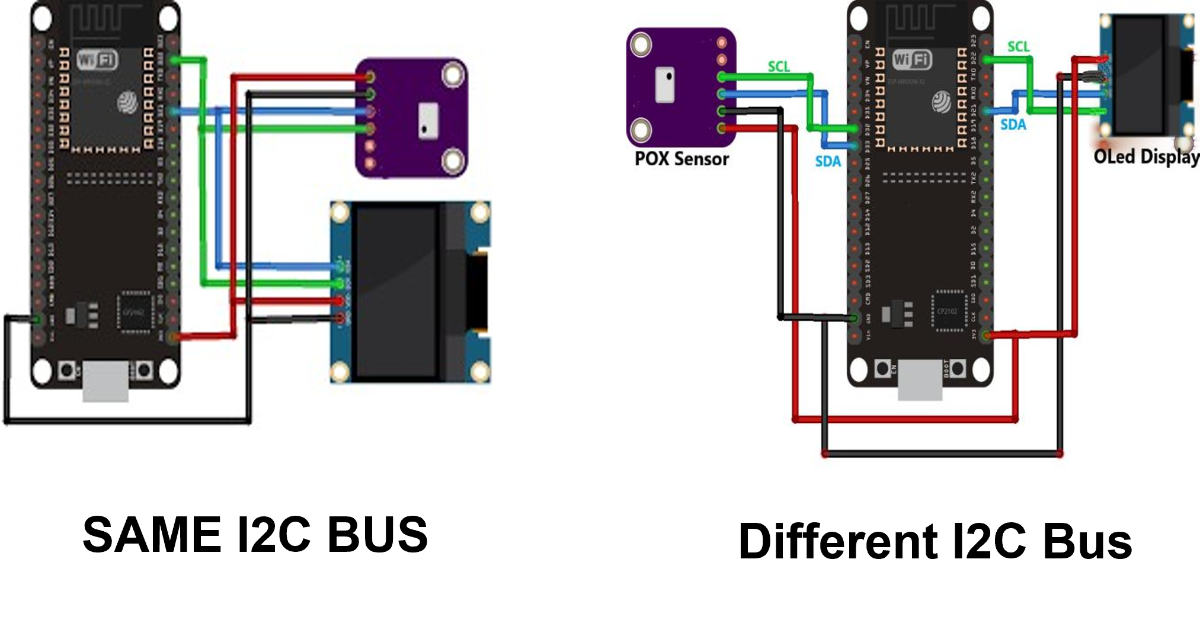
For integrating the Pulse oximeter ic (with controller) with the Oled controller, we use I2C in one master multi-slave mode. We linked both our devices with separate I2C addresses in both the same I2C bus and the Multiple I2C bus interface as the ESP32 has two I2C controllers.
2.3 SENSORS
A sensor is a device that detects changes in the environment and reacts to some other system's output. A sensor turns a physical phenomena into a measurable analogue voltage, which can then be displayed or communicated for further processing. It turns the physical activity to be measured into an electrical counterpart and then processes it so that electrical signals can be sent and processed quickly. The sensor can report whether or not an object is present (binary) or what measurement value was attained.:
The MAX30100 is a sensor that combines pulse oximetry and a heart rate monitor. It detects pulse oximetry and heart rate signals using two LEDs, a photodetector, improved optics, and low noise analogue signal processing. The MAX30100 is powered by 1.8 V (for control and register unit) and 3.3 V (for LEDs and I2C communication with higher logic level MCU) power sources, and it may be turned off via software with a very low standby current, allowing the power supply to stay connected at all times.
The main components of sensing in the IC are the red LED , IR LED , photo diode, ambient temperature sensor , ADC and the control and register units . The Red led here has Wavelength of about 650nm to 670nm and that of IR led is 870nm to 900nm , making the sensor suitable for measuring the absorption by blood in presense of Hb and HbO2 .
The on chip temperature sensor is meant for optional calibration of the SpO2 subsystem on the basis of ambient temperature change as the SpO2 calculation algorithm is critically correct to the interpretaion of the Red light but relatively insensitive to the IR lights wavelength .
The following are Software Programming Components :
2.4 Embedded C
It is a set of digital Machine level language extensions for C programming language set by the C standards committee to make C extensions compatible with various embedded devices . Here in our project we have used embedded c programming in a simplified way with arduino compatible libraries .
Libraries Used :
Arduino C/C++
- Wire : An I2c interfacing Library with functions , syntax , registers and address calls of I2C
- Adafruit_SH110X : Library by Adafruit for Oled display controller enabling it for selectable I2C and SPI interface with its register instructions and simplifying programming functions .
- Adafruit_gfx : Library by Adafruit with set of functions and syntax for simplified graphics illustrations on Oled ,lcds and matrix displays .
- MAX30100_PulseOximeter : Maxim MAX30100 pulse oximetry chip library. This library is made to work with the MAXIM MAX30100 heart rate and oxygen saturation sensor chip. The library's current state allows for the reading of IR values for determining Heart Rate and the manipulation of any register.
2.5 Python :
Numpy : It is a Python library which provides a simple yet a powerful data structure: the n dimensional array. This is the foundation on which almost all the power of Python’s data science toolkit is built, and learning NumPy is also the first step towards learning and knowing Python. It basically stands for Numerical Python. It aims to provide an array object that is up to 50x faster than traditional Python lists.
Pandas :
Pandas is a NumPy-based open source library. It's a Python library with a variety of data structures and methods for handling numbers and data, as well as time series. It's most well-known for making data import and analysis significantly simpler. It is quick and provides users with a high level of performance and productivity. It is simple to load data from a variety of file objects. Missing data in both floating points and non-floating data can be handled easily. Columns can be inserted and deleted from DataFrame and higher dimensional objects, and size mutuality is also available. Data sets can be combined and connected, and data sets can be reshaped and pivoted. It also includes tidbits of information.
Matplotlib :
It's a fantastic Python visualisation toolkit for 2D array graphs. Matplotlib is a multi-function data visualisation toolkit based on NumPy arrays and designed to operate with the SciPy stack as a whole. One of the most important advantages of visualisation is that it provides us with visual access to massive volumes of data in simply understandable graphics.
Seaborn :
Seaborn is a fantastic Python visualisation package for plotting statistical graphs. It comes with attractive default styles and colour palettes to make statistics graphs more appealing. It is based on the matplotlib software and is tightly connected with pandas data structures. Its main goal is to make visualisation a key component of data exploration and comprehension. It also has dataset-oriented APIs, which allow us to move between several visual representations for the same variables to better comprehend the dataset
2.6 A basic Introduction to Machine Learning:
Machine learning is a technique for teaching algorithms to learn from their previous experiences. AI includes machine learning (artificial intelligence). On sample data, Machine Learning algorithms are created from a Joblib file. On the sample data, partitioning for train and test data should be possible so that the algorithms' correctness may be measured later. Spyder, pycharm, Jupyter notebook, and other tools are examples of machine learning algorithms.Machine learning can be divided into three categories, as shown below:
- Machine learning that is supervised
- Machine learning without supervision
- Machine learning with reinforcement
Machine learning that is supervised Data is connected to labels. Unsupervised Machine Learning does not associate labels with data. Machine learning without supervision It is decided to employ a clustering-based method. The feedback-based Reinforcement Machine Learning technique is used.
.Machine learning algorithms are divided into two types based on the data:
- Classification
- Regression
The programmer determines whether to use classification or regression based on the data. Normally, classification algorithms are used when we want to classify specific values, and regression techniques are used when we want to predict continuous variables like temperature.
2.7 Output and Actuator:
OLED DISPLAY Board:
Organic Light-Emitting Diode (OLED) is a technology that employs LEDs to produce light that is produced by organic molecules. A series of organic thin films are pierced between two conductors to create these. A brilliant light is emitted when an electrical current is applied. OLEDs allow for emissive displays, in which each pixel is individually controlled and generates its own light.
2.8 IOT Cloud Platform
Cloud is a very common need for IoT devices today enabling the remote access of Infrastructural facilities and analytics, ex - storage, Api services, security, etc
Blynk
Blynk is an IOT development Platform with app and widgets services mainly for mobile devices . Its app operates on TCP/IP Http protocol for both local and global hosting , the app and development boards connect through a central cloud using a provided API key (authorization token) . Its app has multiple widgets for data streaming , monitoring ,representing, managing and logging, it also has widgets with features of triggering and notifying asper the algorithm of the program and various types or actuators . One of the best part of blynk is that extra hardware for switches , sensor and actuators is not always important to possess as Blynk also provides a virtual pin feature which can be used to program and connect all its virtual widgets.
Max30100 IC Working :
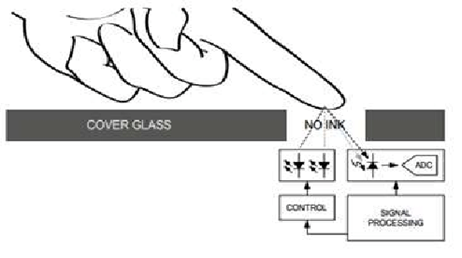
The IC sensing setup has Red Led , IR Led and photodiode, the re .As a finger or artery with significant blood flow/concentration is brought near the sensing region over the glass slab the emitted red and Ir Light enters the blood say up to nail and reflect back to the photodiode after some absorption (as illustrated in the figure below), this absorption is dependent on blood oxygen saturation level due to spontaneous hemoglobin oxygenation.
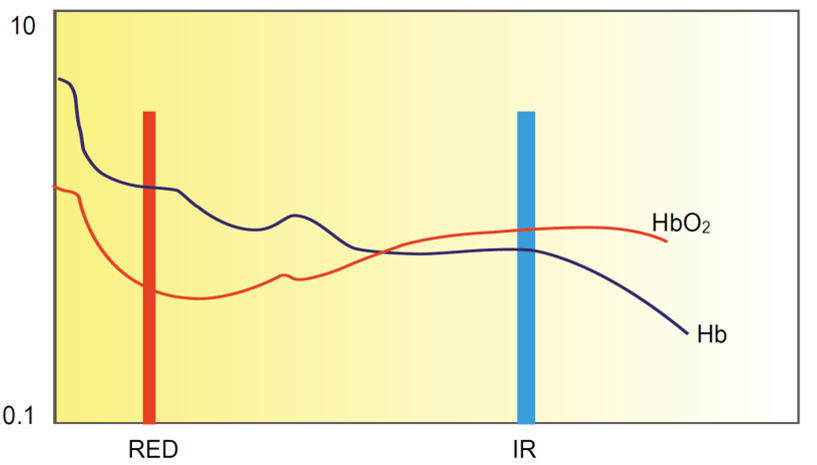
The wavelength of the Red(660nm) and IR (880nm) light makes them suitable for measuring the absorption by the presence of Hb and HbO2 in the flowing blood.
The amount of reflected light signal measured is also dependent on pulse pressure rate causing a volumetric change in presence of arterial blood with hemoglobin, which can further help in determining the ppg curve with diastole and systole
In this arterial blood the deoxygenated hemoglobin absorbs more emissions of red light and allows most of the infrared light to pass through . Where as oxygenated hemoglobin absorbs more emissions of infrared light and allows most of the red light to passing through .
Calculation of Heart rate and SpO2 :
Therefore, at the photodiode or phototransistor output from the reflected light more voltage is generated at the event of deoxygenated blood detection due to infrared light received at about 880nm and at the of event oxygenated blood detection signal voltage is generated due to red light at about 660nm .
The plotted ppg signal wave mainly fluctuates with time mainly due to the increase in amount of increase in blood with each heart beat . The peak transmitted light in each wavelength is subtracted with the minimum transmitted light, by which the effects of other tissues is corrected for allowing for measurement of only the arterial blood .
The ratio of the red light received to the infrared light received is then calculated by the processor , representing the ratio of oxygenated hemoglobin to deoxygenated hemoglobin. This ratio is then used to calculate the blood oxygen level (Spo2%) by the processor using a lookup table based on the Beer-Lambert law .
Working Code Explaination
Arduino Code
#define REPORTING_PERIOD_MS 1000
char ssid[] = "**********";            // WiFi credentials from secrects.h.
char pass[] = "***********";
char auth[] = "UxxDkZFUX4Axh_ZwmCKSDXc6MYDBRgGR"; //Blynk Auth token
Pulseoximeters library functions is allotted with an object pox
Object display of OLED is allotted with screen resolution , I2c controller and its reset value.
PulseOximeter pox;
Adafruit_SH1106G display = Adafruit_SH1106G(SCREEN_WIDTH, SCREEN_HEIGHT, &Wire, OLED_RESET);
'Graphics Bitmap Array', 128x64px in hexadecimal bytes for display themes and UI being added to the program memory
const unsigned char myBitmap [] PROGMEM = {

}
Serial terminal is initialized with baudrate 115200 , and the WiFi with HTTP protocol is initiazed with blynks library using credentials and the cloud apps API key.
  Serial.begin(115200);
  Blynk.begin(auth, ssid, pass);
OLED Display is initialized over I2C , allocating all the addresses and the register and pin values the library . Also keeping a check if the I2c initialization was successful and printing debug statements to the serial terminal accordingly .
 display.begin(Oledi2c_Addr, true);
  if(!display.begin(Oledi2c_Addr,true)) {
    Serial.println(F("SH1106G allocation failed"));
    delay(200);
    for(;;)
    break;
Clearing all the display values if any and putting theme graphics to display to the complete screen from the bitmap array loaded in program memory, and displaying it as per need.
  display.clearDisplay();
  display.drawBitmap(0, 0,  myBitmap,128, 64, SH110X_WHITE);
  display.display();
  delay(800);
  display.invertDisplay(1);
  delay(4000);
  display.clearDisplay();
Pulse oximeter is instructed for update , Bylnk server is initialized and values are fed to the Iot android cloud platform. Function parameters for calculating pulse rate and level of SpO2 is allocated to defined variables of the sensor parameters .
pox.update();
Blynk.run();
BPM = pox.getHeartRate();
SpO2 = pox.getSpO2();
The sensor measured values are being fed to the widgets of the blynk cloud through there allotted virtual pins.
        Blynk.virtualWrite(V7, BPM);
        Blynk.virtualWrite(V8, SpO2);
The OLED is being set for display and the text font size and colour is selected. Also, the cursor is set to the starting of the display .
  display.clearDisplay();
  display.invertDisplay(0);
  display.setTextSize(1);
  display.setTextColor(SH110X_WHITE);
  display.setCursor(0, 0);
Instructions for appropriate spacing , character , measure sensor parameter printing are being called with update at regular intervals .
  display.println(" ");
  display.display();
  delay(100);
  display.println(" ");
  display.display();
  delay(100);
  display.setTextSize(2);
  display.setTextColor(SH110X_WHITE);
  display.print("BPM");
  display.display();
  delay(100);
  display.print(" ");
  display.display();
  delay(100);
  display.print(":");
  display.display();
  delay(100);
  display.print(" ");
  display.display();
  delay(100);
  display.println((int)BPM);
  display.display();
  delay(500);
  display.print("SPO2");
  display.display();
  delay(100);
  display.print(":");
  display.display();
  delay(100);
  display.print(" ");
  display.display();
  delay(100);
  display.print((int)SpO2);
  display.display();
  delay(200);
  display.println("%");
  display.display();
  delay(500);
// display.setTextColor(SH110X_BLACK, SH110X_WHITE);
  display.display();
  delay(4000);
  tsLastReport = millis();
    }
Python Code for ML :
Conditions for predicting the condition of the person
data.loc[(data['BPM'] == 0.00), 'Condition'] = 'Dead'
data.loc[(data['BPM'] < 70) & (data['SPO2'] < 95), 'Condition'] = 'Critical'
data.loc[((data['BPM'] >= 70)&(data['BPM'] <= 90))| ((data['SPO2'] >= 95)&(data['SPO2'] <= 99)), 'Condition'] = 'Normal'
data.loc[(data['BPM'] > 90) & (data['SPO2'] > 100), 'Condition'] = 'Abnormal'
data.head()
data.shape
Plotting heart rate vs time graph:
plt.plot_date(data['Time'], data['BPM'], linestyle='solid')
plt.title('Heart Beat comparison w.r.t Time')
plt.xlabel('<----------------Time---------------->')
plt.ylabel('<----------------Heart Beat----------------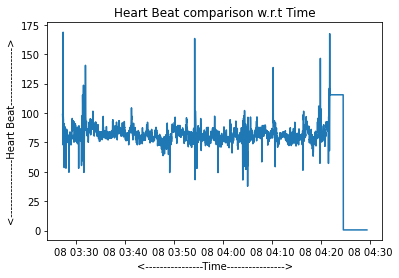
Plotting SPO2 vs time graph
fig, ax = plt.subplots()
ax.plot_date(data['Time'], data['BPM'], linestyle='solid', marker='')
ax
plt.title('Heart Beat comparison w.r.t Time')
plt.xlabel('<----------------Time---------------->')
plt.ylabel('<----------------Heart Beat---------------->')
fig, ax = plt.subplots()
ax.plot_date(data['Time'], data['SPO2'], ydate=True, linestyle='solid')

fig, ax = plt.subplot
ax.plot_date(data['Time'], data['SPO2'], ydate=True, linestyle='solid', marker = '')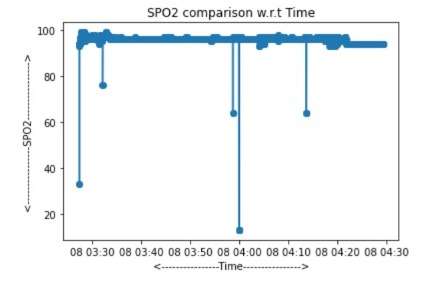
New mean time:
i=0
time = []
while(i<data_length):
    a=data['Minute'][i]
    j=i
    count = 0
    s = 0
    mean = 0
   while(j<data_length):
        if(a == data['Minute'][j]):
           count = count + 1
           j=j+1
       else:
           break

   time.append(data_copy['Time'][j-1])
   i=i+count

#New Hour

i=0
hour = []

while(i<data_length):
    a=data['Minute'][i]
    j=i
    count = 0
    s = 0
    mean = 0
   while(j<data_length):
        if(a == data['Minute'][j]):
           count = count + 1
 j=j+1
       else:
           break

   hour.append(data['Hour'][j-1])
   i=i+count


#New Minute
i=0
minute = []

while(i<data_length):
    a=data['Minute'][i]
    j=i
    count = 0
    s = 0
    mean = 0
   while(j<data_length):
        if(a == data['Minute'][j]):
           count = count + 1
           j=j+1
       else:
           break

   minute.append(data['Minute'][j-1]) i=i+count

#New Second
i=0
second = []

while(i<data_length):
    a=data['Minute'][i]
    j=i
    count = 0
    s = 0
    mean = 0
   while(j<data_length):
if(a == data['Minute'][j]):
           count = count + 1
           j=j+1
       else:
           break

   second.append(data['Second'][j-1])
   i=i+count

print(len(time))
print(len(hour))
print(len(minute))
print(len(second))


#Mean BPM & SPO2
def mean(data,feature):
    i=0
    spo2_mean=[]
   while(i<data_length):
       a=data['Minute'][i]
        j=i
       count = 0
        s = 0
        mean = 0
       while(j<data_length):
           if(a == data['Minute'][j]):
               s = data[feature][j] + s
               count = count + 1
               #spo2_mean = (s/count).astype(int)
                #spo2_mean.append(s/count)
               j=j+1
           else:
               break

        mean = round(s/count,2)
        spo2_mean.append(mean)
       i=i+count
   return(spo2_mean)

#spo2_mean


data_new = pd.DataFrame()

data_new =pd.DataFrame({'Time' : time,
                        'Hour' : hour,
                        'Minute' : minute,
                        'Second' : second })
data_new.head()

for feature in ['BPM','SPO2']:
    xy = mean(data,feature)
    mn = pd.DataFrame(xy)
    data_new = pd.concat([data_new,mn],axis=1)


data_new.columns = ['Time','Hour','Minute','Second','BPM_mean','SPO2_mean']
data_new.head()


data_new.loc[(data_new['BPM_mean'] == 0.00), 'Condition'] = 'Dead'

data_new.loc[((data_new['BPM_mean'] < 60)|(data_new['BPM_mean'] > 100))|
            ((data_new['SPO2_mean'] < 94)|(data_new['SPO2_mean'] > 100)), 'Condition'] = 'Critical'

data_new.loc[((data_new['BPM_mean'] >= 60)&(data_new['BPM_mean'] <= 100))&
            ((data_new['SPO2_mean'] >= 94)&(data_new['SPO2_mean'] <= 99)), 'Condition'] = 'Normal'

data_new.head()

#data_new.to_csv(r'E:\Bio Sensing\PPG_work.csv')

data_new = pd.read_csv(r'C:\Users\WINDOWS HP\Desktop\New folder\PPG_work.csv')
data_new.drop('Unnamed: 0',axis=1,inplace=True)
data_new['Time'] = pd.to_datetime(data_new['Time'])
sns.countplot(x = data_new['Condition'])
plt.title('Count of number of Target Feature')

data_new['Condition'].value_counts().plot(kind='pie',autopct='%.2f')
plt.title('Percentage share of Target Feature')

sns.scatterplot(x = data_new['Time'], y = data_new['BPM_mean'],hue = data_new['Condition'])
sns.scatterplot(x = data_new['Time'], y = data_new['SPO2_mean'],hue = data_new['Condition'])

le=preprocessing.LabelEncoder()
le.fit(['Critical','Normal'])
y=pd.DataFrame()
data_new['Condition'] = le.transform(data_new['Condition'])

data_new.head()

corr = data_new.corr()
plt.figure(figsize=(10,7))
sns.heatmap(corr, annot=True, cmap='coolwarm')

data_new.info()

from sklearn.preprocessing import LabelEncoder
from sklearn.model_selection import train_test_split
from sklearn.metrics import confusion_matrix, accuracy_score, classification_report

x = data_new[['Hour','Minute','Second','BPM_mean','SPO2_mean']]

y = data_new['Condition']

Dividing  data into test and train inorder to train the model

x_train, x_test, y_train, y_test = train_test_split(x, y, test_size = 0.20, random_state = 42)

print('Tota train rows {}'.format(len(x_train)))
print('Tota test rows {}'.format(len(x_test)))
# Training model using Decision Tree Classifier
def training_model():
    from sklearn.tree import DecisionTreeClassifier
   classifier = DecisionTreeClassifier(random_state=42)
   classifier.fit(x_train, y_train)
    return classifier

model = training_model()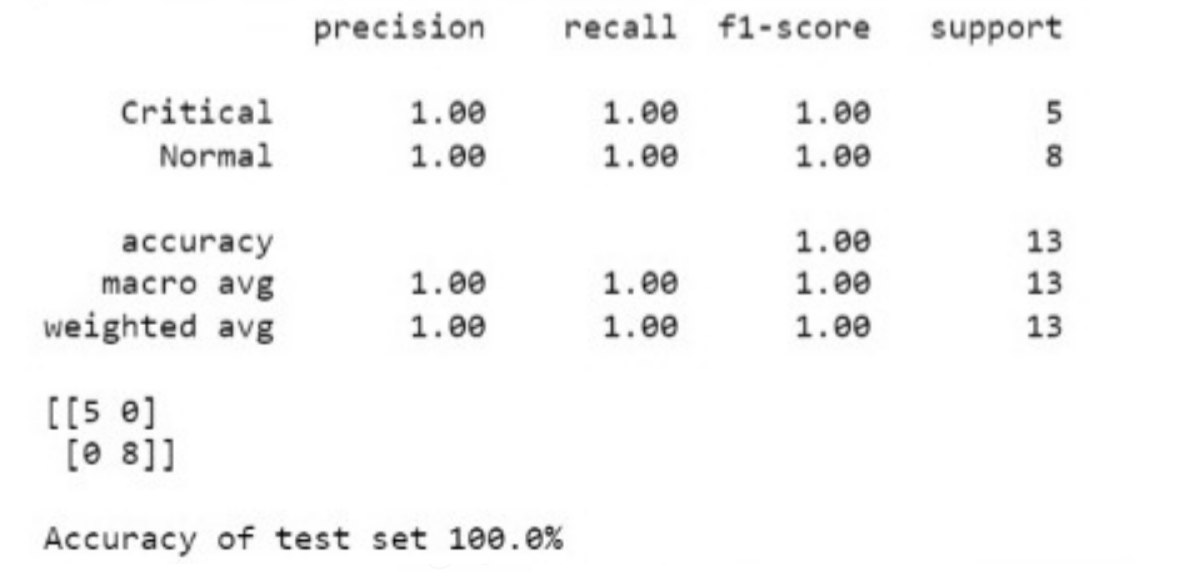
Checking data and testing the model:
   prediction = model.predict(d)
    normal = 'Your health condition is normal'
    critical = 'Yor health condition is critical'

    if prediction == 0:
           return critical
    elif prediction == 1:
           return normal
check_data()
check_data()
check_data()
check_data()
data_new[data_new['Condition']=='Critical']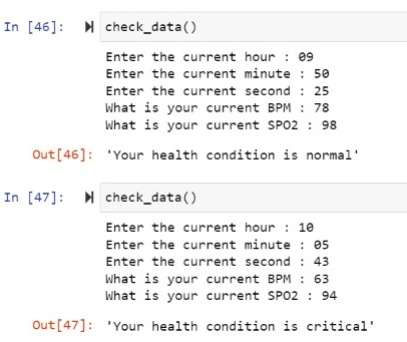
CONCLUSION
________________________________________________
Pulse oximetry is truly vital to medical care, but this prominence carries a responsibility. Too often, pulse oximetry readings are misinterpreted or are erroneous for various reasons (see sidebar). The tendency to accept the percentage at face value is high. Many expensive probes continue to be discarded prematurely as defective. Direct patient interventions can also occur based on erroneous results; worse, patients can be inappropriately monitored, giving caregivers a false sense of security. Pulse oximetry has come a long way since its inception in the early 1800s and with future technology, pulse oximeters will continue to improve patient care more effectively and efficiently.
Measuring your heart rate and oxygen saturation in your blood was not as simple as we had hoped. However, with perseverance, we were able to gain a sufficient understanding of the DSP involved as well as the theory underlying measuring SpO2 to implement it from the ground up. Not only is all of this specific to the MAX30100, but comparable approaches and calculations should be performed on either your own self-built sensor or a sensor made by a company other than Maxim. The MAX30100 allows you to integrate a relatively complex analog circuit into a very small package. However, based on our preliminary studies, we must conclude that monitoring heart rate from the wrist using a sensor is quite challenging. With the existing technique for recognizing peaks, it's practically impossible. It's also worth noting that when measuring oxygen saturation in the paper, I didn't properly calibrate the sensor; instead, I simply altered a standard model to fit what I thought was correct. If you intend to use this sensor to measure SpO2, it is critical that you calibrate it properly.