
Pollution is the introduction of contaminants into the natural environment that cause adverse change. Pollution can take the form of chemical substances or energy, such as noise, heat, or light. Pollutants, the components of pollution, can be either foreign substances/energies or naturally occurring contaminants. Pollution is often classed as point source or non-point source pollution. In 2015, pollution killed 9 million people worldwide. Major forms of pollution include air and sound pollution.
Air pollution is the presence of substances in the atmosphere that are harmful to the health of humans and other living beings or cause damage to the climate or to materials. There are different types of air pollutants, such as gases (such as ammonia, carbon monoxide, sulfur dioxide, nitrous oxides, methane and chlorofluorocarbons), particulates (both organic and inorganic), and biological molecules. Air pollution may cause diseases, allergies and even death to humans; it may also cause harm to other living organisms such as animals and food crops, and may damage the natural or built environment. Both human activity and natural processes can generate air pollution.
It is a significant risk factor for a number of pollution-related diseases, including respiratory infections, heart disease, COPD, stroke and lung cancer. The human health effects of poor air quality are far-reaching, but principally affect the body's respiratory system and the cardiovascular system. Individual reactions to air pollutants depend on the type of pollutant a person is exposed to, the degree of exposure, and the individual's health status and genetics. Indoor air pollution and poor urban air quality are listed as two of the world's worst toxic pollution problems in the 2008 Blacksmith Institute World's Worst Polluted Places report. Outdoor air pollution alone causes 2.1 to 4.21 million deaths annually. Overall, air pollution causes the deaths of around 7 million people worldwide each year and is the world's largest single environmental health risk.
Noise pollution, also known as environmental noise or sound pollution, is the propagation of noise with ranging impacts on the activity of human or animal life, most of them harmful to a degree. The source of outdoor noise worldwide is mainly caused by machines, transport, and propagation systems. Poor urban planning may give rise to noise disintegration or pollution, side-by-side industrial and residential buildings can result in noise pollution in the residential areas. Some of the main sources of noise in residential areas include loud music, transportation(traffic, rail, airplanes, etc.), lawn care maintenance, construction, electrical generators, explosions, and people.
High noise levels can contribute to cardiovascular effects in humans and an increased incidence of coronary artery disease. In animals, noise can increase the risk of death by altering predator or prey detection and avoidance, interfering with reproduction and navigation, and contributing to permanent hearing loss.
Therefore, this has become a growing problem in recent years and its effects are visible in everyday life.
Monitoring is one of the efficient ways to reduce pollution in the cities. The data will indicate the status of the quality of cities. The data, over the long term, allow us to tease out patterns that help support pollution control policy. These patterns include spatial differences in pollution (which areas of the city are more polluted or better) and temporal differences (is there a pattern of pollution levels during the day and/or over the seasons). Pollution monitoring itself does not reduce pollution, it gives us clues on how much is pollution, where is the pollution, and when is that pollution occurs.
So here we are introducing our new way of the static monitoring system, theCity Pollution Monitoring DeviceorCPMD based on Ada. The goal of CPMD is to protect humans and the environment from harmful pollution.
What is CPMD?
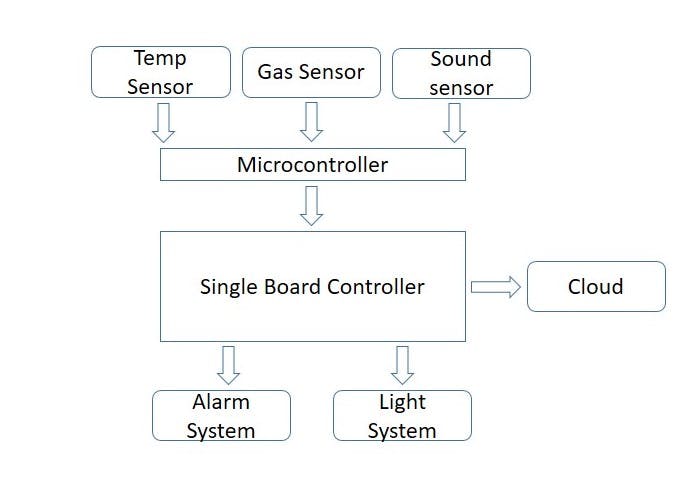
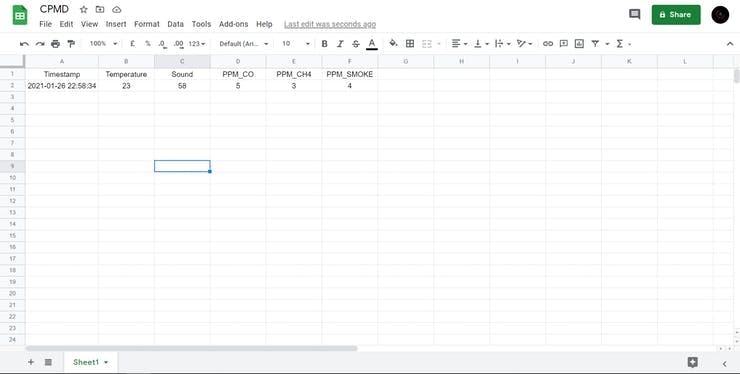
CPMD mainly consist of three types of sensor, the temperature sensor, gas sensor, and sound sensor. It has also contained a Microcontroller and a Single Board computer. An alarming and Light notification system is also included in this device. So it can continuously monitor the temperature in degree celsius, the sound intensity in decibels and smoke level, Carbon Monoxide(CO) level and Methane(CH4) level in part per million. These data are uploaded to the cloud regularly within a time interval of around 10 seconds. Also, these data are plotted in real-time in the cloud as shown above.
To create an accurate Air Quality Index(AQI) we are taking 8-hour averages of pollutants(CO, CH4, Smoke) as a special case used only to determine the pollutant’s daily average concentration. "17" 8-hour values for pollutants are calculated, with the highest one selected as the daily average for our daily air quality index. The methodology is illustrated with example data below.

After calculating the daily average of pollutants, the final pollution level is calculated by taking the average of the daily average of each pollutant. We have created our own air quality index or standard which is shown below.
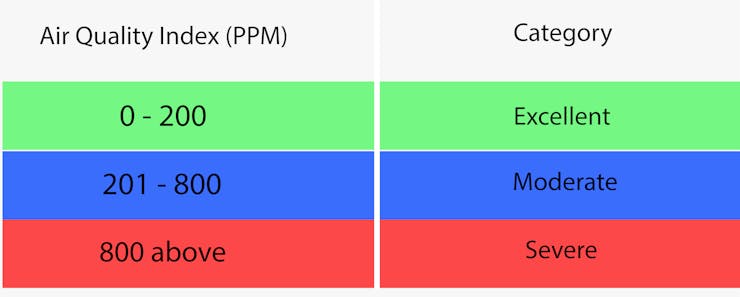
Note: The pink color shown in the cover image does not belong to this standard, it is just given for attractiveness.
So the device can show the air quality status of a city by means of these color indexes with the help of the lighting system. This device will also make alarms when the air quality is severe. This feature is actually useful for the inhabitants of the city. They can self protect themselves from air pollution by doing concerned actions.
The logical flow of CPMD is depicted below.
How does CPMD reduce pollution?
Each CPMD(will be called a node) will be placed over the different cities of a state. The demo of the installation of Nodes is depicted below.
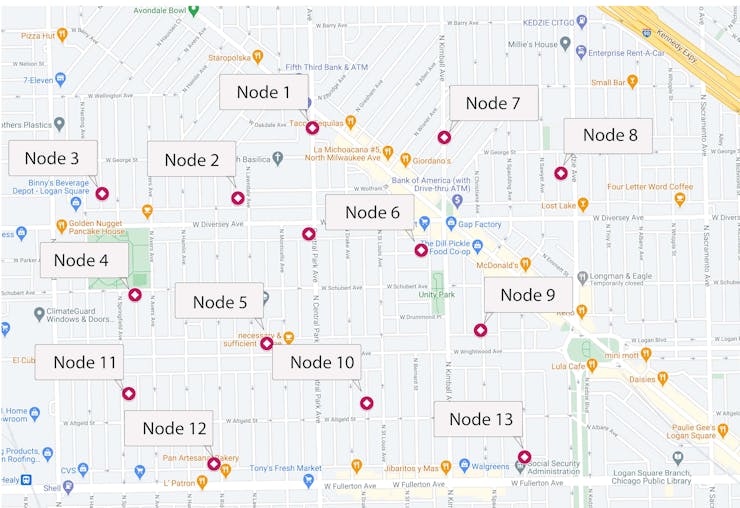
So the pollution level of each city can be monitored by the data collected. The collected data contains temperature, sound intensity, smoke level, CO level and Smoke level of each city and that will be plotted as a graph like this. So the output can be easily visualized by the authorities rather than normal text data.
_vFhLlc3YJa.png?auto=compress%2Cformat&w=740&h=555&fit=max)
_hOIuFf8wML.png?auto=compress%2Cformat&w=740&h=555&fit=max)
By analyzing the graph of each pollutant, the Pollution Control Board can take the necessary actions to control pollution in the specific cities. The control board can take immediate actions when the pollution level exceeded the standard limit.
Research suggests that there is a lack of understanding concerning air quality information among the public. In order to move towards a cleaner and healthier environment, where air pollution does not pose a significant risk to human health, there is a need for a much better understanding of air quality issues among all walks of society. Fortunately, the CPMD can show the air pollution level of the cities by means of the lighting system. So this device can create self-awareness among the people regarding air pollution level in the cities.
This device is also producing big data sets. So we can tackle the air and sound pollution forecasting by machine learning using these big data sets. Machine learning, as one of the most popular techniques, is able to efficiently train a model on big data by using large-scale optimization algorithms. By using this big data as an input we can train an accurate model for forecasting pollutions. The efficiency of the model increases if and only if the available data for training the model is very huge. So the device can predict the pollution level in the city and the pollution control board can take necessary actions to diminish the pollution levels in the specific cities.
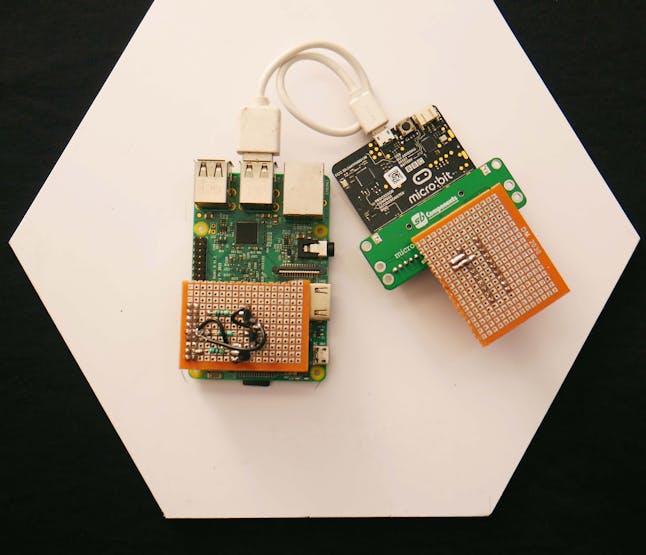
Raspberry and BBC Microbit
The brain of the CPMD is a Raspberry pi model 3B.

The device consists of analog sensors only. As we know the Raspberry Pi computer does not have a way to read analog inputs. It's a digital-only computer. So we need to use the ADC chip like MCP3008 chip to read analog values. Unfortunately, we don't have MCP3008 or similar chips. So we used BBC Microbit to read the analog values. Then the sensor data are passed into the Raspberry pi via serial connection by the USB cable.


We can't easily access all ports on the Microbit. So we need to use an extension board.
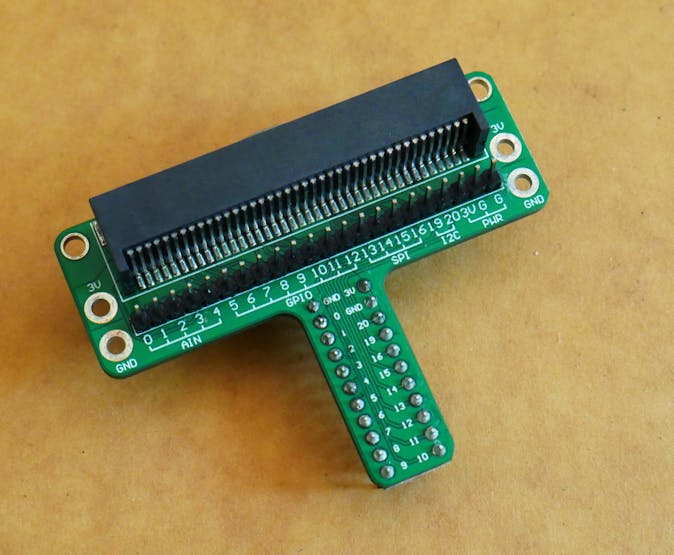
So we can easily connect our sensors to these extension boards via female or male jumpers.
For setting up the raspberry pi just have a look here. After setting up the raspberry pi then we need to install the gnat compiler on the raspberry. Please enter the command given below.
sudo apt-get install gnat gprbuildThen we need to install GNAT Programming Studio(GPS) in the windows for flashing the code to the microbit. For doing that
Download and install GNAT arm-elf hosted on the Windows. This package contains the ARM cross compiler as well the required Ada run-times.
Download and install GNAT native for the Windows. This package contains the GNAT Programming Studio IDE and an example to run on the micro:bit.
For getting started with the micro bit with the ADA, please refer to this one.
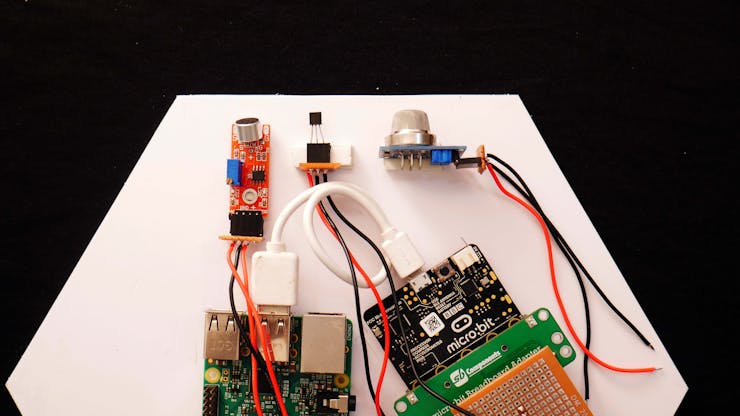
Sensors
The CPMD uses three sensors. So we can go in-depth for each sensor.
MQ2Gas Sensor Module
A gas Sensor is a device that detects the presence or concentration of gases in the atmosphere. Based on the concentration of the gas the sensor produces a corresponding potential difference by changing the resistance of the material inside the sensor, which can be measured as output voltage. Based on this voltage value the type and concentration of the gas can be estimated.
MQ2 gas sensor is suitable for detecting H2, LPG, CH4, CO, Alcohol, Smoke or Propane. Due to its high sensitivity and fast response time, the measurement can be taken as soon as possible. So in this project, we are detecting CO, CH4 and Smoke only. We have only MQ2 gas sensors with us, so we only the provision to the measure those items. They are the main pollutant in the atmosphere which can be measured with the MQ2.

The below graph tells us the concentration of a gas in part per million (ppm) according to the resistance ratio of the sensor (RS/R0).
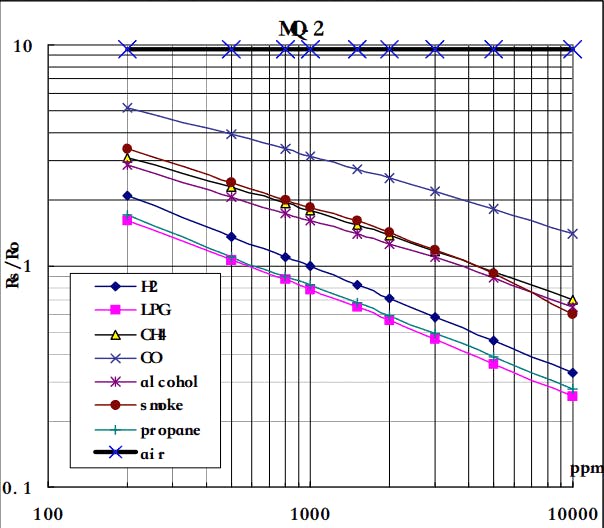
RS is the resistance of the sensor that changes depending on the concentration of gas.
R0 is the resistance of the sensor at a known concentration without the presence of other gases, or in the fresh air.
For air, RS/R0 = 9.8 for MQ2 gas sensor. For finding the R0 for the sensor, we need to find the RS.
RS = (Vin - Vout) / VoutFrom the graph, we can see that the resistance ratio in fresh air is constant.
RS / R0 = 9.8To calculate R0 we wiM vll need to find the value of the RS in the fresh air using the above formula. This will be done by taking the analog average readings from the sensor and converting it to voltage. Then we will use the RS formula to find R0.
R0 = RS / 9.8Run the code for some time to get a stabilized R0 value. We have received R0 value as 1.22436
For getting your own R0 for more accuracy use this function in mq2.adb
function calibrateMQ2 return Float is
Result: Slice_set;
Value,Volt, Rs_air, R0_air : Float;
R : Float := 0.0;
begin
Put_Line("Calibrating...");
for I in 1..20 loop
Value := getSensorValue;
R := R + Value;
end loop;
Value := R/Float(20);
Volt  := getSensorVolt(Value);
Rs_air:= getRs(Volt);
R0_air:= getR0(Rs_air);
Put_Line("Calibrated Successfully");
return R0_air;
end calibrateMQ2;
The scale of the graph is log-log. This means that in a linear scale, the behaviour of the gas concentration with respect to the resistance ratio is exponential.
First of all, we will treat the lines as if they were linear. This way we can use one formula that linearly relates the ratio and the concentration. By doing so, we can find the concentration of a gas at any ratio value even outside of the graph’s boundaries. The formula we will be using is the equation for a line, but for a log-log scale. The formula for a line is
y = mx + bWhere y = X value, x = X value, m = Slope of the line, b = Y intercept.
From this equation, we can derive the formula for gas concentration according to the log-log plot. The formula is given below. For more references just have a look here.
x = 10 ^ {[log(y) - b] / m}Hence we can find the PPM for a particular gas. In the table given below, you can find the value of m and b for different gases

You can find the three functions in mq2.adb to find the PPM of CH4, CO and Smoke.
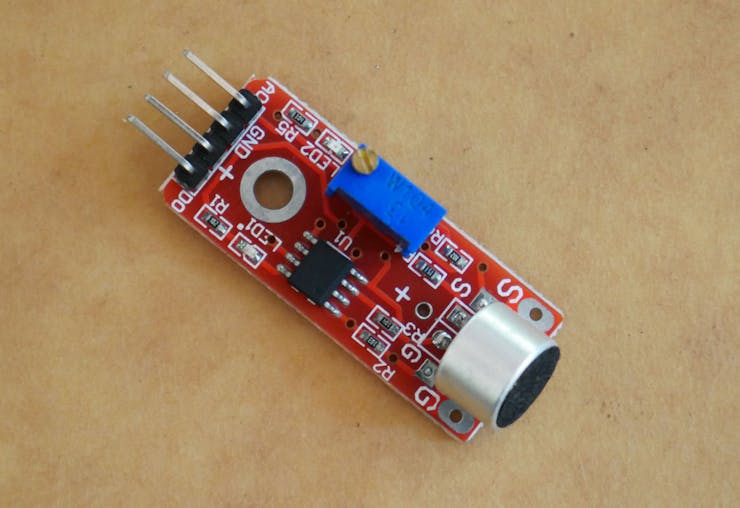
Sound Sensor(ModuleKY-038)
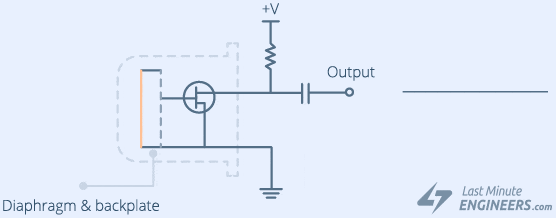
Inside the microphone is the thin diaphragm, which is actually one plate of a capacitor. The second plate is the backplate, which is close to and parallel to the diaphragm. When you speak into the microphone, sound waves created by your voice strike the diaphragm, causing it to vibrate. When the diaphragm vibrates in response to sound, the capacitance changes as the plates get closer together or farther apart. As the capacitance changes, the voltage across the plates changes, which by measuring we can determine the amplitude of the sound.
Here is not that much accuracy in finding the sound intensity in decibels. When you need high accuracy then you'll need to calibrate your microphone against a known decibel meter and sound source. A free smartphone app might do for the sound meter if you're not too bothered about high accuracy. In this project, I didn't calibrate with any of the sound meters. The open-circuit voltage of the microphone doesn't tell you anything about the sound intensity if it's not calibrated. Here I have used the equation. It is just scaling.
dB = 20 log10(ADC_value)This is just a beta version. The highly calibrated sensor will be used in future upgrades.
Temperature Sensor(TMP36)

These sensors use a solid-state technique to determine the temperature. That is to say, they don't use mercury (like old thermometers). Instead, they use the fact as temperature increases, the voltage across a diode increases at a known rate. By precisely amplifying the voltage change, it is easy to generate an analog signal that is directly proportional to temperature. There have been some improvements on the technique but, essentially that is how temperature is measured.
The TMP36 is a low voltage, precision centigrade temperature sensor. One of the most exciting features of this sensor is that it, it doesn't require any external calibration to provide typical accuracies of ±1°C at +25°C and ±2°C over the −40°C to +125°C temperature range. The output voltage can be converted to temperature easily using the scale factor of 10 mV/°C.
It can accept voltage ranges from 2.7V to 5V. So it is very useful for connecting with the Microbit.
Configuring Zapier and Google Sheet
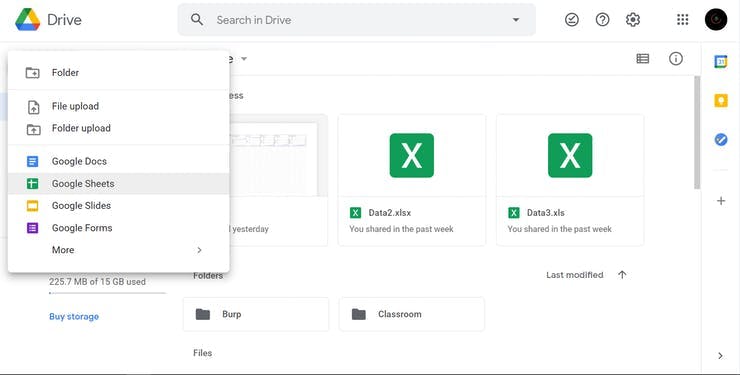
Zapier will be used to save the data to a Google Sheet. Every time a new data is created, Zapier will create a new row in the Google Sheet and fill the columns with the appropriate data value. To do this we first need to make a Google Sheet in Google Drive.
Step 1: Go to your Drive and start with a Blank spreadsheet.
Step 2: The first row will be the name of the data field (column). Put the name of every column according to your data. In the second row just put a sample value for every data. It will help Zapier to identify the data field correctly.
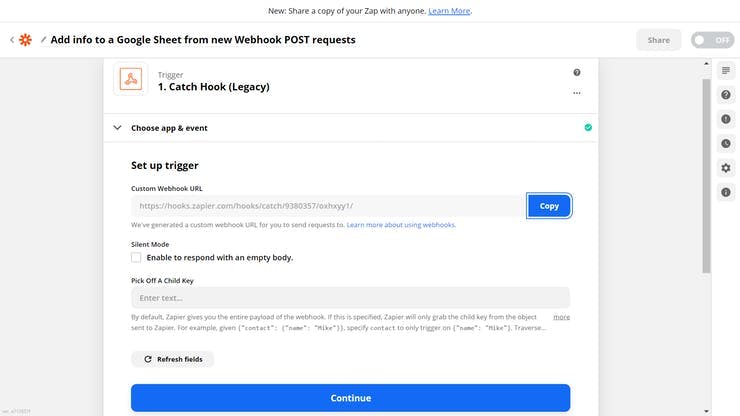
Step 3: Go here and login if you have already created an account. Otherwise, create the account first. After logging in press Try It.

Step 4. It will create a custom URL, copy the URL and continue.
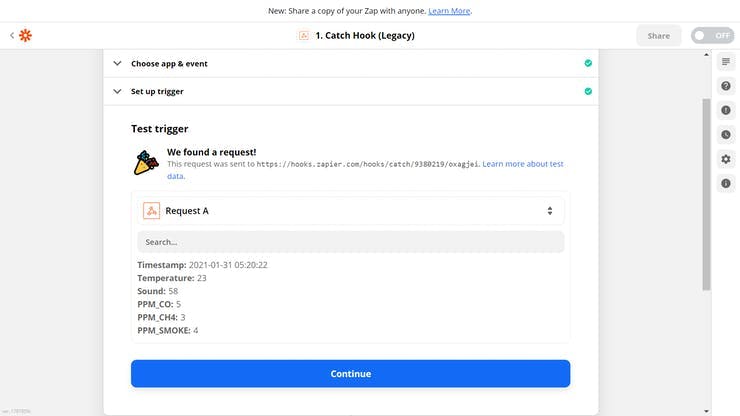
Now, just to test the trigger, send a request like this using CURL
curl -X POST https://hooks.zapier.com/hooks/catch/9380219/oxagjei -d "Timestamp= 2021-01-31 05:20:22&Temperature= 23&Sound= 58&PPM_CO= 5&PPM_CH4= 3&PPM_SMOKE= 4Now you will get a response in CMD like this
{"id": "57b91b11-a28d-4f29-8ff7-c282438ed76d", "request_id": "6016a1b9-0238-4992-9fed-b1f6e7bcccc0", "attempt": "6016a1b9-0238-4992-9fed-b1f6e7bcccc0", "status": "success"}After you get this response, let's test the trigger. It should show
Step 5. After the test succeeds, let's continue to set up Google Sheets. Now click edit in the next step Create Spreadsheet Row in Google Sheets.

Now continue and fill in the required details as shown below


Step 6. Now send a test data and see if it gets added to the Google Sheet.

If everything is set up successfully we get a new row created.

Now add the widgets like chart and the final output will be like this
_V2eysjsEhh.png?auto=compress%2Cformat&w=740&h=555&fit=max)
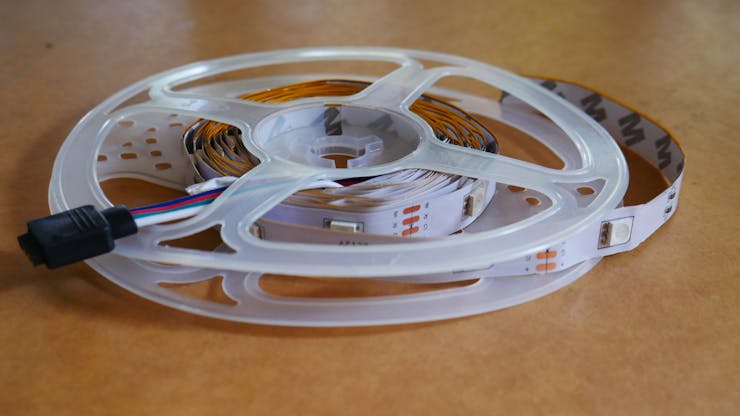
Buzzer and RGB Led strip
RGB strip is used to indicate the Air quality status based on the air quality index.
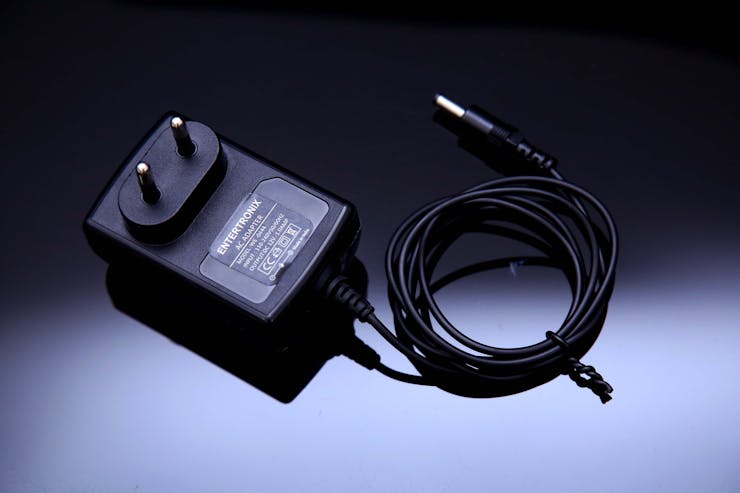
For the CPMD we need to light up 18 LED. Each RGB LED draws approximately about 60 mA when it is set to full brightness and powered at 5V. So for the 18 LED's we need a current of around 0.8A So we can't power it up with the Raspberry pi. From the GPIO of raspberry, we can draw a maximum current of around 16mA. So we planned to use 12V 1A adapter for powering up the led's.
For driving the led's with the raspberry pi GPIO we use transistors. Here we are using 2N2222A –NPN Transistor.
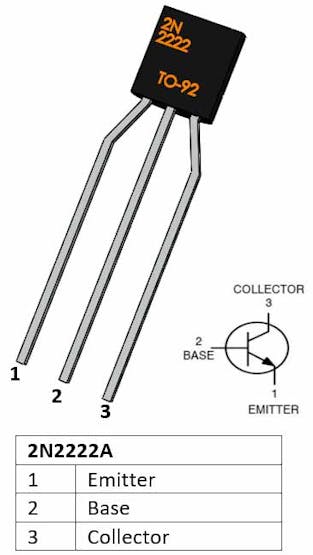
The 2N2222A transistor is very much similar to the commonly used NPN transistor BC547. But there are two important features that distinguish both. 2N2222A can allow collector current up to 800mA and also has a power dissipation of 652mW which can be used to drive larger loads than compared with BC547. So we can easily drive the RGB strip with the transistors by means of Pi GPIO's. Here we used three transistors to light up Red, Blue and Green led's. Refer circuit given below for more information.
Another problem is that we can't power the raspberry with this power supply. The recommended input voltage of raspberry is 5V and the recommended input current is 2A.
So we need to use a Linear voltage regulator. They are very cheap but not that much efficient. So here we are using LM2596S DC-DC buck converter.
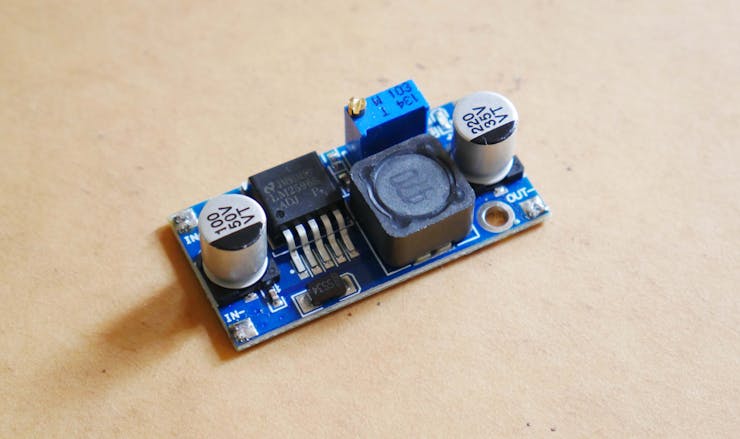
For setting the required output voltage(5.1 V) in buck converter just turn the potentiometer. The buck converter can deliver a current of 3A(max) which is enough for raspberry pi.
Note : If an incorrect voltage is applied, or a current spike occurs on the line you can permanently damage your Raspberry Pi. So be careful,
For the alarm, we have used a normal buzzer. But it's sound intensity is very high. So that will be very useful in alerting the people to a greater distance. It is directly connected to the Raspberry GPIO.

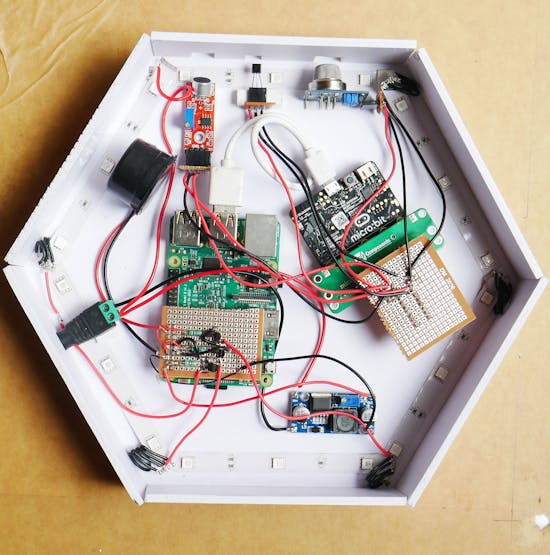
Case and Circuit
For making the case we have used foam sheets of 0.5 mm thickness.

From this, I have cut out a regular hexagon base to make my device attractive.

Before proceeding to the further case making, we can have a look on the bare circuit.
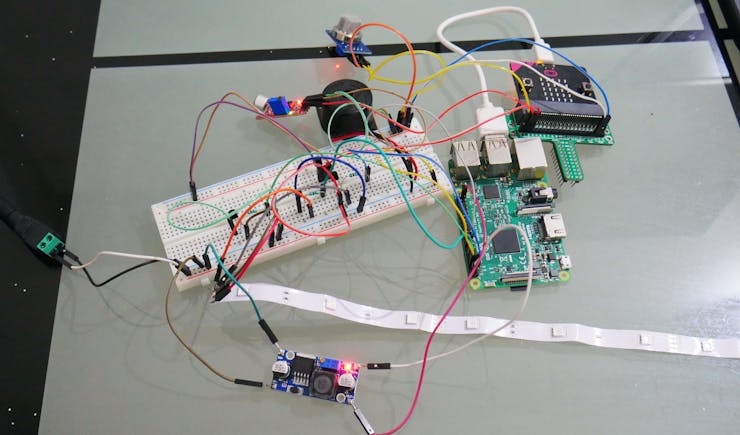
We need to shift this circuit to the perforated board. So let's start soldering with along with case making.

I have used 24 AWG and 26 AWG wires for soldering. We have first placed the raspberry and microbit in the hexagon base by attaching the PCB hats for connecting remaining stuff.
Then we can attached the three sensors on the base.
Then we can attached the buzzer and buck converter.

Then we attached the RGB led strip.

Then we made pillars for these base.

Here we a made a hole in this pillar for the DC jack to give power. Then we can make three holes for the three sensors in another pillar.
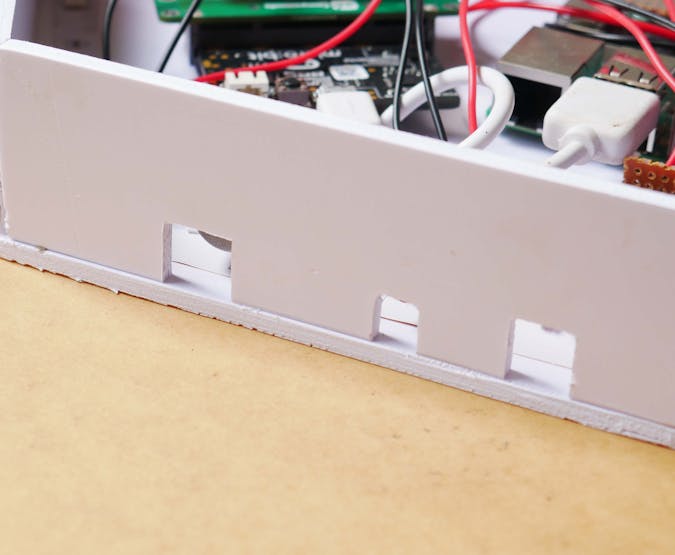
To throw the buzzer sound outside of the enclosure, we have made this on the pillar.

Then we attached the remaining pillars.
For closing the front side we have cut out a white acrylic sheet. This is purposefully done to make a glow effect.

To restrict the glow to certain portions, we have just painted out the acrylic sheet with black colour.
So we attached our logo to the acrylic sheet and made our CPMD!!

Future Upgrades
This is the just a beta version. The future update includes.
Other than CH4, CO and Smoke we will also detect the Ground-level ozone, Carbon monoxide, Sulfur dioxide,Nitrogen dioxide and aerosols in the future upgrade with dedicated sensors for each. The detection of certain air pollutants in the air usually requires a more precise and costly instrument, which cannot be done with a single gas sensor. So we will attach dedicating sensors for each pollutant in the coming upgrades for very accurate measurement.
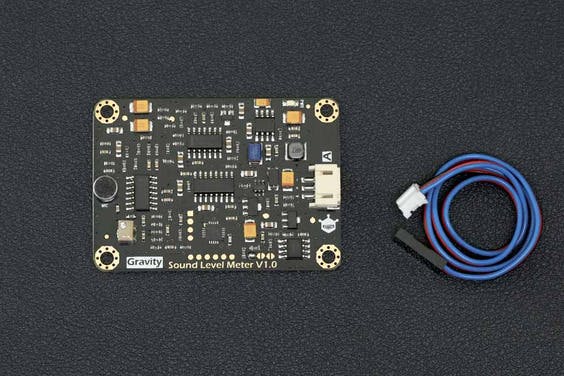
The sound sensor which is used now has no that much accuracy. So that will be replaced with the GravityAnalog Sound Level Meter.
The TMP117 temperature sensor will be used instead of TMP36 for more accuracy. It has an accuracy of ±0.1°C.

In this version, we are using Single Board Computer and also the microcontroller. In the future version, we will replace both boards with a single board.
- A dedicated PCB will be made.
- Solar panels will be added to make it a self-powered device.
- Powerful AI models will be generated in future upgrades by using the data generated from the sensors. So these models can be used for predicting the upcoming hikes in the pollution level of the specific cities.
- Weather prediction will also be done by means of these generated data.
- Standard Air Quality Index will be followed instead of the custom-made one.
References
https://www.breeze-technologies.de/blog/what-is-an-air-quality-index-how-is-it-calculated/
http://urbanemiisionsinfo.com/
https://onlinelibrary.wiley.com/doi/full/10.1111/j.1440-1843.2011.02065.x