DigiKey myList: https://www.digikey.in/en/mylists/list/MOT842XUTD
Why needed?
India’s bridges are mostly managed through manual, infrequent inspections, which means engineers see only snapshots of condition instead of continuous behavior. Traditional bridge manuals and guidelines themselves admit that scheduled inspections give only “limited knowledge of structural condition” and can miss internal or evolving damage between visits. In India, the situation is worse because overall maintenance is weak: a study on Indian bridges noted that around 70% of bridges are old and need repairs, 57% are over 80 years old, and, at the time of that report, virtually no bridges had permanent health‑monitoring systems installed. The result is a visible integrity crisis—media analyses show about 170 bridge collapses causing 202 deaths and 441 injuries between 2021 and mid‑2025, with many more incidents of partial failure and closure. NCRB data also records hundreds of deaths over the past decade due to collapse of bridges, with single events like the Morbi disaster killing roughly 140 people in one incident. In short, India has many aging structures, very few automated monitoring systems, and a heavy reliance on occasional visual surveys that miss early warning signs; a low‑cost SHM solution that continuously tracks vibrations, temperature, and environmental stress, and predicts future risk, directly addresses this gap by turning “no or rare monitoring” into real‑time, evidence‑based safety assurance.


Proposed Solution:
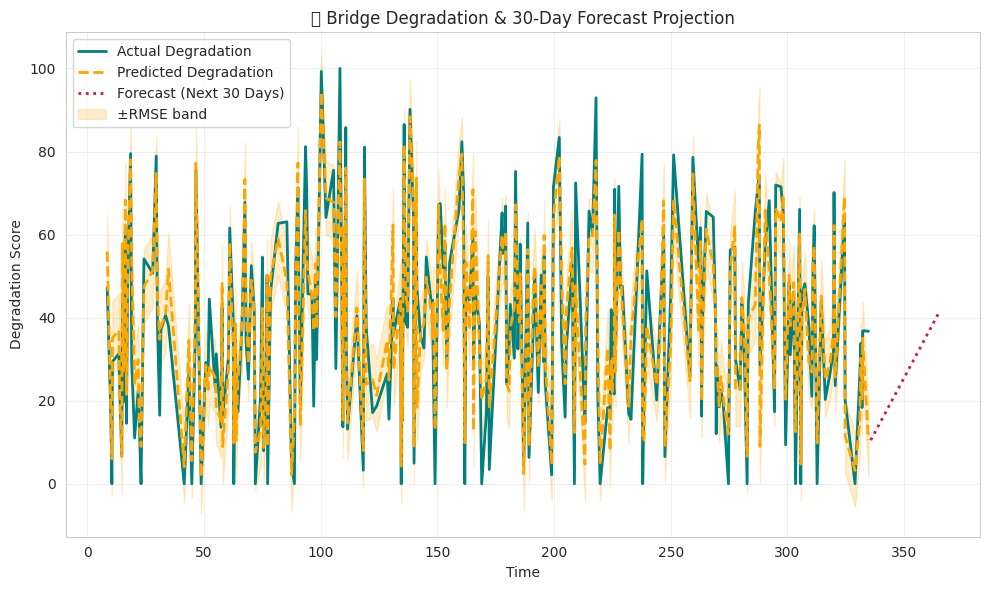
The proposed solution is an end‑to‑end structural health monitoring platform that transforms raw structural and environmental data into real‑time, interpretable intelligence for bridge safety and maintenance planning. Continuous measurements of vibration, motion, temperature, and humidity are converted into engineered features such as dominant frequency peaks, waveform statistics, degradation indicators, temperature deviation from baseline, and moisture‑driven corrosion risk indices. Machine learning models use these features to estimate a continuous degradation score and generate short‑term forecasts of how the score will evolve, enabling early detection of abnormal behavior and prediction of when a structure may transition from safe to warning or critical states.
Sensor Node Layer
- Continuously acquires vibration and environmental signals at multiple points on the structure.
- Performs feature extraction ( FFT‑based metrics, trend and rate‑of‑change indicators, jerk and energy measures) to dramatically reduce data volume before transmission.
- Locally computes health classification (normal, moderate, severe) and a degradation score using trained models, then sends current state, key features, and forecasted risk.
- Supports battery operation and intermittent connectivity, making the nodes suitable for remote or hard‑to‑access bridges.
Dashboard and Digital Twin Layer
- Provides a unified web interface that aggregates data from the node in real time.
- Hosts an interactive 3D digital twin of the structure where placed segment is color‑coded by health class (green->normal / yellow->moderate / red->severe) based on degradation score and forecasts.
- Displays linked plots for vibration waveforms, degradation‑score history, forecast trends, temperature deviation bands, and corrosion‑risk levels derived from humidity exposure.
Prototype Development
Phase-1: ML model development
Dataset link : https://drive.google.com/file/d/1LUykIYIrB46ipFPTkSz3vKjcqrpYK-4d/view?usp=drivesdk
Development Platform: Jupyter Notebook/Google Colab
(i) Importing libraries
import os
import joblib
import numpy as np
import pandas as pd
import matplotlib.pyplot as plt
import seaborn as sns
from sklearn.model_selection import train_test_split
from sklearn.impute import SimpleImputer
from sklearn.preprocessing import LabelEncoder, StandardScaler
from sklearn.metrics import r2_score, mean_squared_error, mean_absolute_error, accuracy_score, classification_report
import lightgbm as lgb
(ii) Data Acquisition
bridge=pd.read_csv("/content/bridge_dataset.csv")
(iii) Feature engineering
bridged = bridged.sort_values("time_since_start").reset_index(drop=True)

# Rolling degradation trends
bridged["degradation_roll_mean_5"] = bridged["degradation_score"].rolling(5, min_periods=1).mean()
bridged["degradation_roll_std_5"]  = bridged["degradation_score"].rolling(5, min_periods=1).std().fillna(0)

# Lag features for key signals
for col in ["accel_magnitude", "temperature_c", "humidity_percent", "degradation_score"]:
    bridged[f"{col}_lag1"] = bridged[col].shift(1)
    bridged[f"{col}_lag2"] = bridged[col].shift(2)

# Rolling vibration features
bridged["accel_mag_roll_mean_5"] = bridged["accel_magnitude"].rolling(5, min_periods=1).mean()
bridged["accel_mag_roll_std_5"]  = bridged["accel_magnitude"].rolling(5, min_periods=1).std().fillna(0)

# Environmental interaction
bridged["temp_humidity_ratio"] = bridged["temperature_c"] / (bridged["humidity_percent"] + 1e-3)

# Ensure 'degradation_rate' exists before computing 'degradation_rate_smooth'

# If not, recompute it here for robustness.
if 'degradation_rate' not in bridged.columns:
    print(" 'degradation_rate' not found, recomputing from 'degradation_score.diff()'")
    bridged['degradation_rate'] = bridged['degradation_score'].diff()

# Smoothed degradation rate
bridged["degradation_rate_smooth"] = bridged["degradation_rate"].rolling(3, min_periods=1).mean()

# Drop NaNs from shift ops
bridged = bridged.dropna().reset_index(drop=True)
(v) Feature List
features = [
    # Environmental
    "temperature_c", "humidity_percent", "temp_delta", "humidity_temp_ratio", "temp_humidity_ratio",

    # Frequency-domain
    "fft_peak_freq", "fft_magnitude",

    # Vibration
    "accel_magnitude", "accel_y_rms", "accel_z_mean", "accel_z_rms",
    "accel_mag_roll_mean_5", "accel_mag_roll_std_5",

    # Dynamics/time
    "accel_x_delta", "degradation_rate", "time_since_start", # Added 'degradation_rate', removed 'degradation_rate_smooth'
    "degradation_rate_smooth", # Add the derived feature here now that it's calculated.

    # Trend / Lag
    "degradation_roll_mean_5", "degradation_roll_std_5",
    "accel_magnitude_lag1", "accel_magnitude_lag2",
    "temperature_c_lag1", "temperature_c_lag2",
    "humidity_percent_lag1", "humidity_percent_lag2"
    # PSD features will be added by a separate cell later
]

target_deg = "degradation_score"
target_fore = "forecast_score_next_30d"
target_cond = "structural_condition"
(vi) Model training and testing
if bridged[target_cond].dtype == "object": # Use bridged[target_cond] directly
le = LabelEncoder()
bridged[target_cond] = le.fit_transform(bridged[target_cond]) # Apply encoding to bridged
print("Condition classes:", list(le.classes_))
X_pre_psd = bridged[features]
y_deg_pre_psd = bridged[target_deg]
y_fore_pre_psd = bridged[target_fore]
y_cond_pre_psd = bridged[target_cond]
X_train, X_test, y_deg_train, y_deg_test = train_test_split(X_pre_psd, y_deg_pre_psd, test_size=0.2, random_state=42)
_, _, y_fore_train, y_fore_test = train_test_split(X_pre_psd, y_fore_pre_psd, test_size=0.2, random_state=42)
imp = SimpleImputer(strategy="median")
X_train = imp.fit_transform(X_train)
X_test = imp.transform(X_test)
def eval_regression(y_true, y_pred, name):
r2 = r2_score(y_true, y_pred)
rmse = np.sqrt(mean_squared_error(y_true, y_pred)) # Fixed here for older sklearn
mae = mean_absolute_error(y_true, y_pred)
print(f"\n {name} Metrics:")
print(f" R² = {r2:.3f}")
print(f" RMSE = {rmse:.3f}")
print(f" MAE = {mae:.3f}")
return r2, rmse, mae
def plot_importance(model, title):
# Ensure features list is passed if X is an array
feature_names = features if hasattr(model, 'feature_names_') else [f'Feature {i}' for i in range(model.n_features_in_)]
fi = pd.Series(model.feature_importances_, index=feature_names).sort_values()
plt.figure(figsize=(7,5))
fi.tail(15).plot(kind="barh", color="teal")
plt.title(title)
plt.tight_layout()
plt.show()
# Tuned LightGBM params
reg_params = {
"n_estimators": 800,
"learning_rate": 0.03,
"max_depth": 8,
"num_leaves": 64,
"min_child_samples": 10,
"subsample": 0.8,
"colsample_bytree": 0.8,
"random_state": 42,
"n_jobs": -1
}
cls_params = {
**reg_params,
"class_weight": "balanced"
}
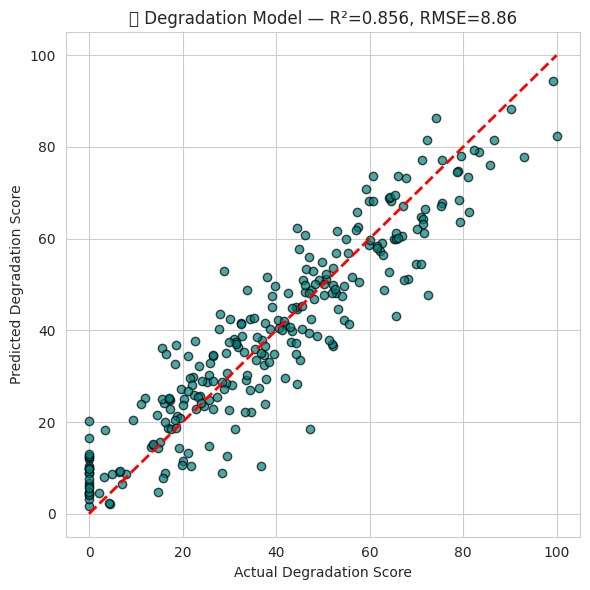
# Degradation model
deg_model = lgb.LGBMRegressor(**reg_params)
deg_model.fit(X_train, y_deg_train)
y_pred_deg = deg_model.predict(X_test)
eval_regression(y_deg_test, y_pred_deg, "Degradation (Enhanced)")
plot_importance(deg_model, "Degradation Feature Importance")
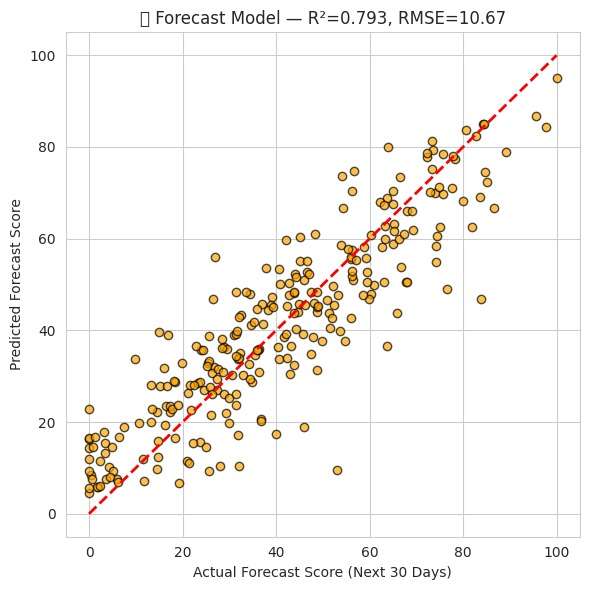
# Forecast (30D) model
fore_model = lgb.LGBMRegressor(**reg_params)
fore_model.fit(X_train, y_fore_train)
y_pred_fore = fore_model.predict(X_test)
eval_regression(y_fore_test, y_pred_fore, "Forecast (Enhanced)")
plot_importance(fore_model, "Forecast Feature Importance")
# Cross-validation for degradation stability
cv = KFold(n_splits=5, shuffle=True, random_state=42)
cv_r2 = cross_val_score(deg_model, X_pre_psd[features], y_deg_pre_psd, cv=cv, scoring="r2")
print(f"\nCross-validated R² (Degradation): {cv_r2.mean():.3f} \u00b1 {cv_r2.std():.3f}")
# Model performance
print("\nFinal Summary")
print(f"Degradation R²: {r2_score(y_deg_test, y_pred_deg):.3f}")
print(f"Forecast R²: {r2_score(y_fore_test, y_pred_fore):.3f}")
(v) Model deployment
deg_model = joblib.load("models/model_degradation.joblib")
features = joblib.load("models/model_forecast.joblib")
(vi) Model Metrics
Phase-2: Sensor node integration
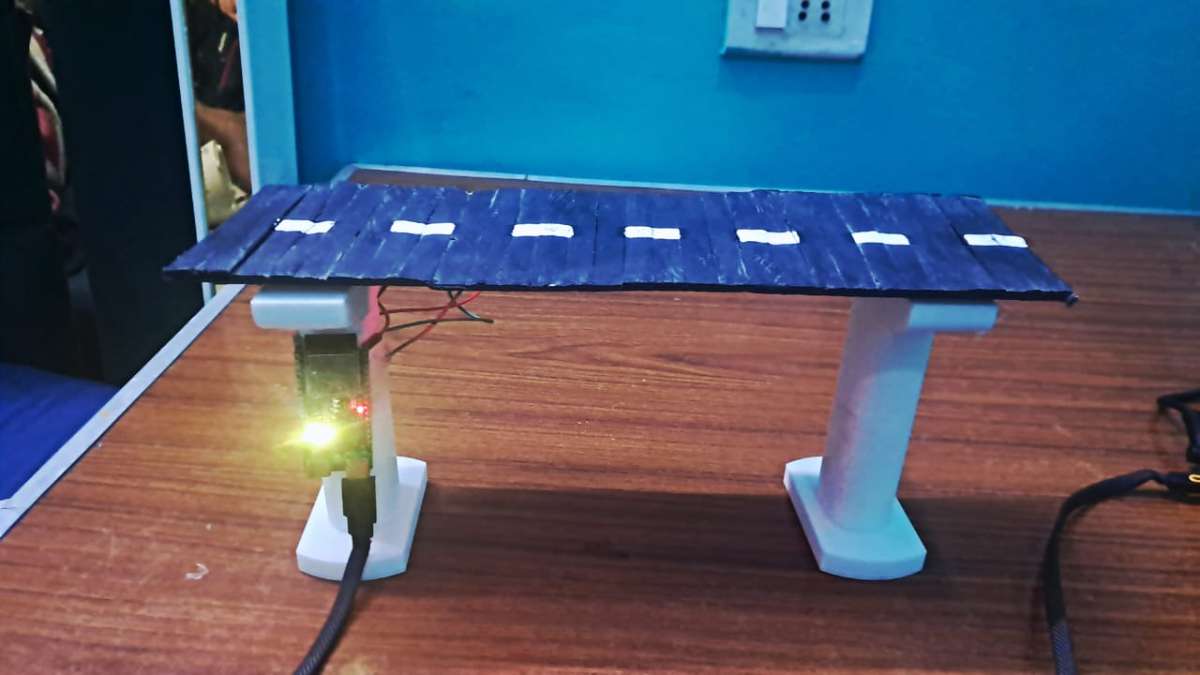
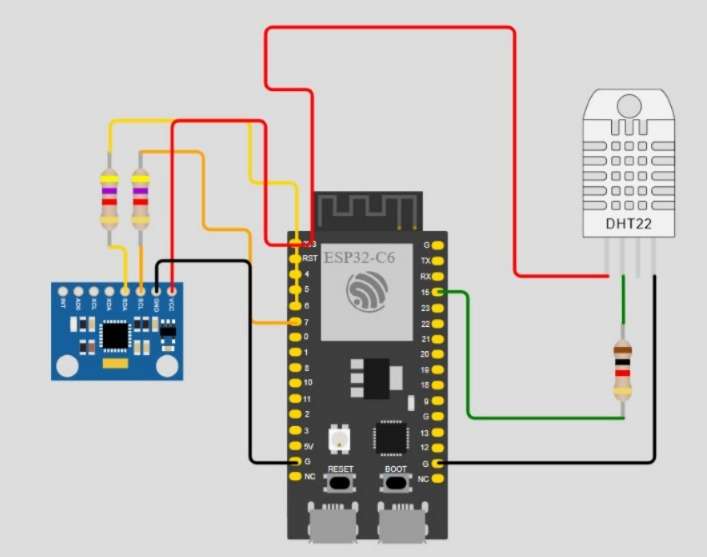
(i) Components used : MPU6050(x1) , ESP32 C6(x1), DHT11/22(x1), 4.7k-ohm(x2), Jumper wires(x7-8)
(i-a) ESP32-C6-DEVKITC-1-N8 BOARD
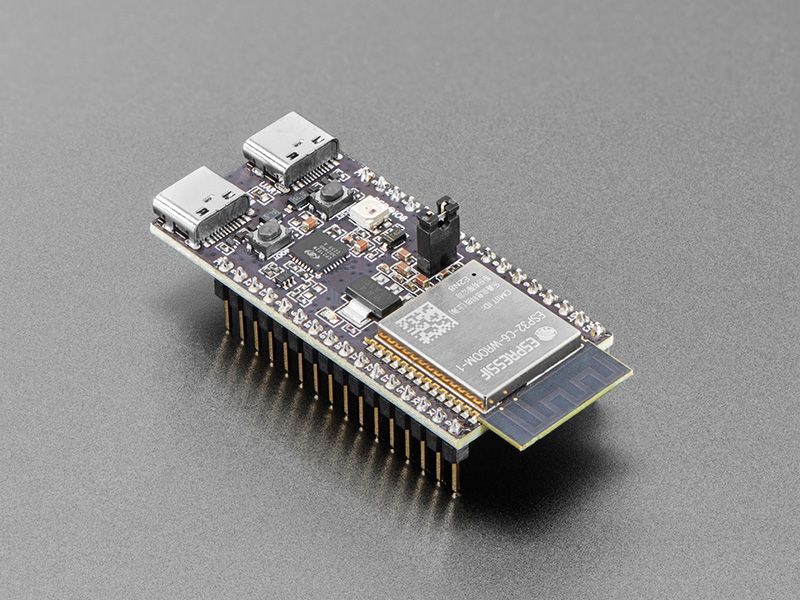
The ESP32-C6-DEVKITC-1-N8 is a Wi-Fi 6 and Bluetooth LE 5.0 enabled RISC-V IoT development board that serves as the edge sensing and communication hub in this Structural Health Monitoring system. It collects real-time vibration data from the MPU6050 accelerometer-gyroscope and environmental readings from the DHT11 sensor, processes them locally, and transmits structured JSON data to the AI/ML inference API over fast and reliable Wi-Fi 6. With its low-power architecture, secure communication features, built-in NeoPixel RGB LED for on-device status alerts, and wide peripheral compatibility, the ESP32-C6 provides a robust, future-ready platform for continuous bridge condition monitoring, enabling live anomaly detection, degradation forecasting, and intuitive dashboard visualizations.
(i-b) MPU6050 sensor module

The MPU6050 is a 6-axis MEMS motion sensor that integrates a 3-axis accelerometer and 3-axis gyroscope into a single compact, low-power chip, making it ideal for real-time vibration and motion analysis. In this Structural Health Monitoring project, the MPU6050 plays the critical role of capturing micro-vibrations and structural oscillations of the bridge. These acceleration (X/Y/Z) and angular velocity readings form the core input for AI models that compute degradation trends, detect anomalies, and track the dynamic behavior of the structure. Its I²C interface allows seamless communication with the ESP32-C6, while its high sensitivity and fast sampling make it highly suitable for continuous monitoring of structural health in low-cost IoT deployments.
(i-c) DHT 11 module

The DHT11 is a low-cost digital temperature and humidity sensor designed for basic environmental monitoring. In this Structural Health Monitoring project, the DHT11 provides essential context data—temperature and humidity—which directly influence structural stress, material expansion, and corrosion progression. These readings are used to compute parameters such as thermal index, temp–humidity ratios, and corrosion risk levels, all of which feed into the AI models for forecasting degradation and assessing real-time bridge conditions. With its simple single-wire interface and stable performance, the DHT11 offers an easy and reliable way to incorporate environmental factors into the SHM analysis, enhancing the system’s overall accuracy and insight.
(ii) Wiring(ESP32-C6 -> MPU6050)
| ESP32 C6 | MPU6050 |
| 3V3 | VCC |
| GND | GND |
| pin 6 | SCL |
| pin 7 | SDA |
(iii) Wiring(ESP32-C6 -> DHT11)
| ESP32 C6 | DHT11 |
| 5V | VCC |
| GND | GND |
| 4 | Do |
Schematic( if using DHT11, no need for the resistor)
Connecting Pins for the single node
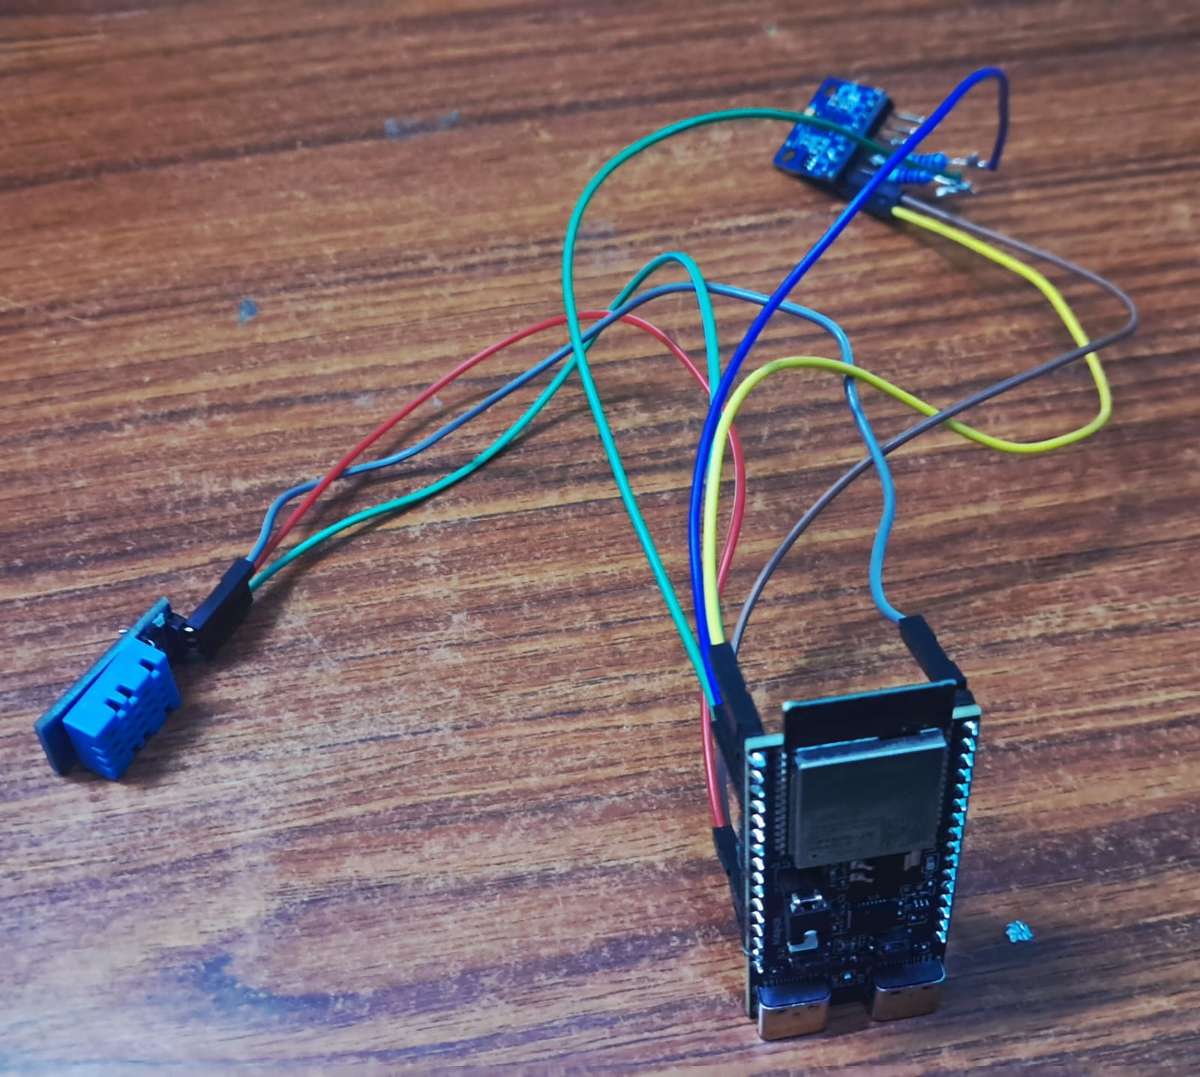
Placement of the node on the structure
.jpeg)
(iv) IDE code
Development Platform : Arduino IDE
Language: C++/ Embedded C
#include <Wire.h>
#include <WiFi.h>
#include <HTTPClient.h>
#include "MPU6050_light.h"
#include "DHT.h"
#include <Adafruit_NeoPixel.h>


#define SDA_PIN 6
#define SCL_PIN 7

#define DHTPIN 4
#define DHTTYPE DHT11

#define LED_PIN 8           #built-in pin on esp32-C6
#define LED_COUNT 1


MPU6050 mpu(Wire);
DHT dht(DHTPIN, DHTTYPE);
Adafruit_NeoPixel rgb(LED_COUNT, LED_PIN, NEO_GRB + NEO_KHZ800);

//API endpoints
const char* WIFI_SSID = "enter your wifi";
const char* WIFI_PASS = "enter your wifi_password";

const char* API_URL = "http://ENTER-YOUR-DEVICE-IP:8000/sensor";   // Your API endpoint

String device_id = "esp32-bridge-1";

unsigned long lastSend = 0;
const int SEND_INTERVAL = 300;  // ms

//on board LED
void setColor(uint8_t r, uint8_t g, uint8_t b) {
  rgb.setPixelColor(0, rgb.Color(r, g, b));
  rgb.show();
}


void setup() {
  Serial.begin(115200);
  delay(500);

  rgb.begin();
  setColor(0, 0, 20);   // boot (blue)

  // WiFi
  Serial.println("Connecting to WiFi...");
  WiFi.begin(WIFI_SSID, WIFI_PASS);
  while (WiFi.status() != WL_CONNECTED) {
    Serial.print(".");
    delay(300);
  }
  Serial.println("\nWiFi Connected!");
  Serial.println(WiFi.localIP());
  setColor(0, 20, 0);   // green = WiFi OK

  // MPU6050
  Wire.begin(SDA_PIN, SCL_PIN);
  if (mpu.begin() != 0) {
    Serial.println("MPU6050 init failed!");
    setColor(30, 0, 0);
    while (1);
  }
  Serial.println("MPU OK! Calibrating...");
  mpu.calcOffsets();   // gyro/accel calibration

  // DHT11
  dht.begin();
}


void loop() {

  mpu.update();

  if (millis() - lastSend < SEND_INTERVAL) return;
  lastSend = millis();


  float ax = mpu.getAccX();
  float ay = mpu.getAccY();
  float az = mpu.getAccZ();

  float gx = mpu.getGyroX();
  float gy = mpu.getGyroY();
  float gz = mpu.getGyroZ();

  float temp = dht.readTemperature();
  float hum  = dht.readHumidity();

  if (isnan(temp)) temp = 0;
  if (isnan(hum))  hum  = 0;

  //Json
  String json = "{";
  json += "\"device_id\":\"" + device_id + "\",";
  json += "\"ax\":" + String(ax, 6) + ",";
  json += "\"ay\":" + String(ay, 6) + ",";
  json += "\"az\":" + String(az, 6) + ",";
  json += "\"gx\":" + String(gx, 6) + ",";
  json += "\"gy\":" + String(gy, 6) + ",";
  json += "\"gz\":" + String(gz, 6) + ",";
  json += "\"temperature\":" + String(temp, 2) + ",";
  json += "\"humidity\":" + String(hum, 2);
  json += "}";

  Serial.println("\nPOST JSON:");
  Serial.println(json);

  //HTTP POST
  HTTPClient http;
  http.begin(API_URL);
  http.addHeader("Content-Type", "application/json");

  int code = http.POST(json);
  Serial.print("POST CODE: ");
  Serial.println(code);

  if (code > 0) {
    String resp = http.getString();
    Serial.println("API Response:");
    Serial.println(resp);

    //LED Based on AI Condition
    if (resp.indexOf("\"condition\":\"severe\"") != -1) {
        setColor(40, 0, 0);   // RED
    }
    else if (resp.indexOf("\"condition\":\"moderate\"") != -1) {
        setColor(40, 15, 0);  // ORANGE
    }
    else if (resp.indexOf("\"condition\":\"minor\"") != -1) {
        setColor(40, 40, 0);  // YELLOW
    }
    else if (resp.indexOf("\"condition\":\"normal\"") != -1) {
        setColor(0, 40, 0);   // GREEN
    }
    else {
        setColor(0, 0, 40);   // BLUE (fallback)
    }
  }

  http.end();
}
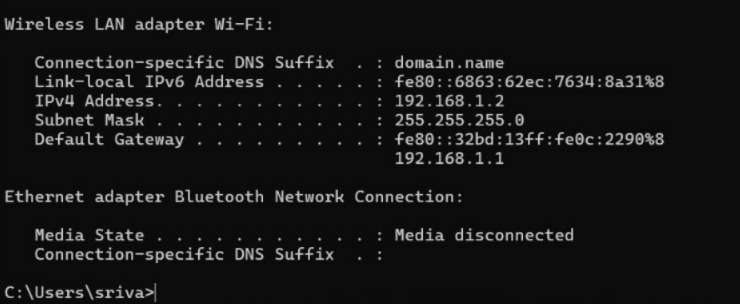
To find your device IP run ipconfig on windows terminal, and look under Wireless LAN adapter Wi-Fi section, copy the address of IPv4 Address and paste it in the instructed space in the IDE code.
Phase-3: API development
Development Platform: VS Code
Language : Python(3.10 and above)
Tool: Flask API
from flask import Flask, request, jsonify
from flask_cors import CORS
import time, joblib, numpy as np
from collections import deque

app = Flask(__name__)
CORS(app)

#ML models
forecast_model    = joblib.load("model_forecast.joblib")
degradation_model = joblib.load("model_degradation.joblib")


FEATURES = [
    "acceleration_x","acceleration_y","acceleration_z",
    "temperature_c","humidity_percent",
    "accel_magnitude",
    "temp_humidity_ratio","humidity_temp_ratio","thermal_index",
    "accel_mag_lag1","accel_mag_lag2",
    "temp_lag1","humidity_lag1",
    "accel_mag_roll_mean_5","accel_mag_roll_std_5",
    "fft_peak_freq","fft_magnitude"
]


# History buffer for rolling/lags
HISTORY = deque(maxlen=50)
SAMPLE_COUNT = 0


# FEATURE EXTRACTION
def extract_features(raw, hist):

    ax, ay, az = raw["ax"], raw["ay"], raw["az"]
    gx, gy, gz = raw["gx"], raw["gy"], raw["gz"]
    t = raw["temperature"]
    h = raw["humidity"]

    accel_mag = np.sqrt(ax*ax + ay*ay + az*az)
    gyro_mag  = np.sqrt(gx*gx + gy*gy + gz*gz)

    # Thermal Index (baseline 20°C)
    thermal_index = t - 20

    # Corrosion risk
    if h < 60:
        corrosion = "low"
    elif h < 80:
        corrosion = "moderate"
    else:
        corrosion = "high"

    # Lags
    if len(hist) >= 2:
        lag1 = hist[-1]["accel_mag"]
        lag2 = hist[-2]["accel_mag"]
        temp_lag1 = hist[-1]["temperature"]
        hum_lag1  = hist[-1]["humidity"]
    else:
        lag1 = lag2 = accel_mag
        temp_lag1 = t
        hum_lag1 = h

    # Rolling stats
    roll_vals = [x["accel_mag"] for x in hist][-5:]
    roll_mean = float(np.mean(roll_vals)) if roll_vals else accel_mag
    roll_std  = float(np.std(roll_vals)) if roll_vals else 0

    # FFT fallback
    if len(hist) >= 1:
        fft_freq = hist[-1].get("fft_peak_freq", 0.0)
        fft_mag  = hist[-1].get("fft_magnitude", 0.0)
    else:
        fft_freq = 0.0
        fft_mag = 0.0

    fft_drift = (fft_freq - hist[-2]["fft_peak_freq"]) if len(hist) >= 3 else 0

    return {
        "acceleration_x": ax,
        "acceleration_y": ay,
        "acceleration_z": az,
        "temperature_c": t,
        "humidity_percent": h,

        "accel_magnitude": accel_mag,
        "temp_humidity_ratio": t / (h + 1e-5),
        "humidity_temp_ratio": h / (t + 1e-5),
        "thermal_index": thermal_index,

        "accel_mag_lag1": lag1,
        "accel_mag_lag2": lag2,
        "temp_lag1": temp_lag1,
        "humidity_lag1": hum_lag1,

        "accel_mag_roll_mean_5": roll_mean,
        "accel_mag_roll_std_5": roll_std,

        "fft_peak_freq": fft_freq,
        "fft_magnitude": fft_mag,
        "fft_drift": fft_drift,

        "accel_mag": accel_mag,
        "gyro_mag": gyro_mag,
        "corrosion_risk": corrosion,
        "temperature": t,
        "humidity": h
    }

# CONDITION AI
def classify_condition(deg, fore, anomaly, corrosion):
    score = (
        0.4 * deg +
        0.3 * fore +
        0.2 * anomaly +
        0.1 * (10 if corrosion == "high" else 5 if corrosion == "moderate" else 0)
    )

    if score < 25: return "normal"
    if score < 45: return "minor"
    if score < 70: return "moderate"
    return "severe"


# ANOMALY AI (Z-score)
def compute_anomaly(accel_mag, hist):
    values = [v["accel_mag"] for v in hist][-20:]

    if len(values) < 5:
        return 0, "normal"

    mean = np.mean(values)
    std  = np.std(values) + 1e-5
    z = abs((accel_mag - mean) / std)

    if z < 1.5: return z, "normal"
    if z < 3.0: return z, "warning"
    return z, "critical"


#Sensor Endpoints
@app.route("/sensor", methods=["POST"])
def sensor():
    global SAMPLE_COUNT
    SAMPLE_COUNT += 1

    raw = request.json

    # Handle ESP32 alternative names
    if "temperature" not in raw and "temperature_c" in raw:
        raw["temperature"] = raw["temperature_c"]
    if "humidity" not in raw and "humidity_percent" in raw:
        raw["humidity"] = raw["humidity_percent"]

    # Compute features
    feats = extract_features(raw, HISTORY)

    # Store
    HISTORY.append(feats)

    # ML Inference
    X = [[feats[f] for f in FEATURES]]

    degradation_pred = float(degradation_model.predict(X)[0])
    forecast_pred    = float(forecast_model.predict(X)[0])

    # Anomaly detection
    zscore, anomaly_level = compute_anomaly(feats["accel_mag"], HISTORY)

    # Final condition
    condition = classify_condition(
        degradation_pred,
        forecast_pred,
        zscore,
        feats["corrosion_risk"]
    )

    # Final response
    response = {
        **feats,
        "anomaly_zscore": float(zscore),
        "anomaly_level": anomaly_level,
        "degradation_pred": degradation_pred,
        "forecast_30d_pred": forecast_pred,
        "condition": condition,
        "risk_score": round((degradation_pred + forecast_pred) / 2, 2),
        "samples_collected": SAMPLE_COUNT,
        "timestamp_server": time.time()
    }

    return jsonify(response), 200


@app.route("/latest")
def latest():
    return jsonify(HISTORY[-1] if HISTORY else {})


@app.route("/stats")
def stats():
    return jsonify({"samples": SAMPLE_COUNT})


if __name__ == "__main__":
    print("AI API Running at http://0.0.0.0:8000")
    app.run(host="0.0.0.0", port=8000, debug=True)
Phase 4: Dashboard
Development Platform: VS Code
Language: HTML, CSS, Three.JS, Chart.JS
<!DOCTYPE html>
<html lang="en">
<head>
  <meta charset="UTF-8">
  <title>Bridge Health Monitoring Dashboard</title>

  <!-- Three.js + OrbitControls -->
  <script src="https://cdn.jsdelivr.net/npm/[email protected]/build/three.min.js"></script>
  <script src="https://cdn.jsdelivr.net/npm/[email protected]/examples/js/controls/OrbitControls.js"></script>

  <!-- Chart.js -->
  <script src="https://cdn.jsdelivr.net/npm/chart.js"></script>

  <style>
    * { margin: 0; padding: 0; box-sizing: border-box; }
    body { font-family: 'Segoe UI', sans-serif; background: #0a0a0a; color: #fff; overflow: hidden; }

    #container { display: flex; height: 100vh; width: 100vw; }

    #bim-view {
      flex: 2;
      position: relative;
      min-width: 400px;
      min-height: 400px;
    }

    #sidebar {
      flex: 1;
      background: #141414;
      padding: 20px;
      overflow-y: auto;
      border-left: 1px solid #222;
    }

    h2 { color: #00ffcc; margin-bottom: 10px; }
    .status-card {
      background: linear-gradient(135deg, #1e1e1e, #2a2a2a);
      border-radius: 12px;
      padding: 20px;
      margin-bottom: 20px;
      box-shadow: 0 4px 20px rgba(0,0,0,0.3);
    }

    .health-state { font-size: 2em; font-weight: bold; margin-bottom: 10px; }
    .metric { margin: 8px 0; font-size: 1.05em; }
    .metric span { color: #00ffcc; font-weight: bold; }

    .risk-meter {
      height: 25px;
      background: #1a1a1a;
      border-radius: 15px;
      overflow: hidden;
      margin-top: 10px;
    }
    .risk-fill {
      height: 100%;
      background: linear-gradient(90deg, #00ff88, #ffff00, #ff4444);
      width: 10%;
      border-radius: 15px;
      transition: width 0.6s ease;
    }

    /* Gauges */
    #gauges {
      position: absolute;
      top: 15px;
      left: 15px;
      display: flex;
      gap: 20px;
      z-index: 9999;
    }

    #gauges canvas {
      background: #111;
      border-radius: 50%;
      padding: 8px;
      box-shadow: 0 0 12px rgba(0,255,255,0.3);
    }
  </style>
</head>

<body>

<!-- GAUGES -->
<div id="gauges">
  <canvas id="thermalGauge" width="140" height="140"></canvas>
  <canvas id="corrosionGauge" width="140" height="140"></canvas>
</div>

<div id="container">
  <div id="bim-view"></div>

  <div id="sidebar">

    <div class="status-card">
      <h2>Bridge Health Status</h2>
      <div class="health-state" id="health-state">LOADING...</div>

      <div class="metric">Condition: <span id="cond">--</span></div>
      <div class="metric">Degradation Score: <span id="degradation">--</span></div>
      <div class="metric">Forecast (Next 30d): <span id="forecast">--</span></div>
      <div class="metric">Confidence: <span id="confidence">--</span></div>

      <h3 style="margin-top:10px; color:#00ffcc;">Risk Meter</h3>
      <div class="risk-meter"><div class="risk-fill" id="risk-fill"></div></div>
    </div>

    <div class="status-card">
      <h2>Forecast Trends</h2>
      <canvas id="trendChart"></canvas>
    </div>

    <div class="status-card">
      <h2>Vibration Waveform</h2>
      <canvas id="waveformChart" height="120"></canvas>
    </div>

    <div class="status-card">
      <h2>API Stats</h2>
      <div class="metric">Total Samples: <span id="total-samples">--</span></div>
      <div class="metric">Latest Ping: <span id="ping">--</span></div>
    </div>

  </div>
</div>

<script>
/*API URLs*/
const API_LATEST = "http://SAME_IP_AS_ON_ARDUINO_IDE:8000/latest";
const API_STATS  = "http://SAME_IP_AS_ON_ARDUINO_IDE:8000/stats";

/* 3D SETUP */
const container = document.getElementById('bim-view');
const scene = new THREE.Scene();
scene.background = new THREE.Color(0x0a0a0a);

const camera = new THREE.PerspectiveCamera(
  75,
  container.clientWidth / container.clientHeight,
  0.1,
  1000
);
camera.position.set(8, 4, 8);

const renderer = new THREE.WebGLRenderer({ antialias: true });
renderer.setPixelRatio(window.devicePixelRatio);
renderer.setSize(container.clientWidth, container.clientHeight);
container.appendChild(renderer.domElement);

window.addEventListener("resize", () => {
  renderer.setSize(container.clientWidth, container.clientHeight);
  camera.aspect = container.clientWidth / container.clientHeight;
  camera.updateProjectionMatrix();
});

/* Orbit Controls */
const controls = new THREE.OrbitControls(camera, renderer.domElement);
controls.enableDamping = true;
controls.dampingFactor = 0.05;
controls.target.set(0, 1.5, 0);

/* Bridge Model */
const pillarGeo = new THREE.CylinderGeometry(0.3, 0.3, 3, 32);
const pillarMat = new THREE.MeshPhongMaterial({ color: "#555" });

const p1 = new THREE.Mesh(pillarGeo, pillarMat);
p1.position.set(-3, 0, 0);

const p2 = new THREE.Mesh(pillarGeo, pillarMat);
p2.position.set(3, 0, 0);

const bridgeGeo = new THREE.BoxGeometry(8, 0.4, 1.2);
const bridgeMat = new THREE.MeshPhongMaterial({ color: "#00ff88" });
const bridge = new THREE.Mesh(bridgeGeo, bridgeMat);
bridge.position.y = 1.75;

const group = new THREE.Group();
group.add(p1); group.add(p2); group.add(bridge);
scene.add(group);

scene.add(new THREE.AmbientLight(0xffffff, 0.4));
const light = new THREE.DirectionalLight(0xffffff, 1);
light.position.set(5, 5, 5);
scene.add(light);

/* CONDITION COLOR */
function applyConditionColor(condition) {
  if (condition === "normal") {
    bridge.material.color.set("#00ff88");
  } else if (condition === "minor") {
    bridge.material.color.set("#ffff00");
  } else if (condition === "moderate") {
    bridge.material.color.set("#ff8800");
  } else if (condition === "severe") {
    bridge.material.color.set("#ff0000");
  }
}

/* THERMAL HEATMAP */
function applyThermalColor(thermalIndex) {
  const t = Math.min(1, Math.max(0, (thermalIndex + 10) / 30));
  let heat = new THREE.Color();

  if (t < 0.3) heat.setRGB(0, t/0.3, 1);
  else if (t < 0.6) heat.setRGB((t-0.3)/0.3, 1, 0);
  else heat.setRGB(1, 1-(t-0.6)/0.4, 0);

  bridge.material.color.lerp(heat, 0.08);   //  small tint only
  p1.material.color.set("#555");
  p2.material.color.set("#555");
}

/* Animate */
function animate() {
  requestAnimationFrame(animate);
  controls.update();
  renderer.render(scene, camera);
}
animate();

/* Gauges */
function drawGauge(ctx, val, min, max, label, color) {
  const W = ctx.canvas.width;
  const c = W / 2;
  const r = W * 0.38;
  ctx.clearRect(0, 0, W, W);

  ctx.beginPath();
  ctx.strokeStyle = "#333";
  ctx.lineWidth = 12;
  ctx.arc(c, c, r, Math.PI, 0);
  ctx.stroke();

  const pct = (val - min) / (max - min);
  const angle = Math.PI + pct * Math.PI;

  ctx.beginPath();
  ctx.strokeStyle = color;
  ctx.lineWidth = 12;
  ctx.arc(c, c, r, Math.PI, angle);
  ctx.stroke();

  ctx.beginPath();
  ctx.strokeStyle = "white";
  ctx.moveTo(c, c);
  ctx.lineTo(c + Math.cos(angle)*r, c + Math.sin(angle)*r);
  ctx.stroke();

  ctx.fillStyle = "#00ffcc";
  ctx.textAlign = "center";
  ctx.font = "14px Segoe UI";
  ctx.fillText(label, c, c + 40);
}

const thermalCtx = document.getElementById("thermalGauge").getContext("2d");
const corrosionCtx = document.getElementById("corrosionGauge").getContext("2d");

/* Charts */
const trendChart = new Chart(document.getElementById("trendChart"), {
  type: "line",
  data: { labels: [], datasets: [
    { label: "Degradation", borderColor: "#ff9900", data: [], tension: 0.3 },
    { label: "Forecast", borderColor: "#00ffcc", data: [], tension: 0.3 }
  ]},
  options: { animation: false }
});

const waveformChart = new Chart(document.getElementById("waveformChart"), {
  type: "line",
  data: { labels: [], datasets: [{
    label: "Vibration",
    borderColor: "#00ccff",
    backgroundColor: "rgba(0,200,255,0.15)",
    pointRadius: 0,
    borderWidth: 2,
    tension: 0.25,
    data: []
  }]},
  options: {
    animation: false,
    plugins: { legend: { display: false }},
    scales: {
      x: { display: false },
      y: { ticks: { color: "#aaa" } }
    }
  }
});

/* API Refresh */
async function refresh() {
  try {
    const latest = await fetch(API_LATEST).then(r => r.json());
    const stats  = await fetch(API_STATS).then(r => r.json());

    if (!latest.condition) return;

    /* Set condition UI */
    document.getElementById("health-state").textContent = latest.condition.toUpperCase();
    document.getElementById("cond").textContent = latest.condition;
    document.getElementById("degradation").textContent = latest.degradation_score;
    document.getElementById("forecast").textContent = latest.forecast_30d;
    document.getElementById("confidence").textContent = latest.confidence;

    document.getElementById("risk-fill").style.width = (latest.degradation_score * 100) + "%";

    /* Apply bridge colors */
    applyConditionColor(latest.condition);
    applyThermalColor(latest.thermal_index);

    /* Gauges */
    drawGauge(thermalCtx, latest.thermal_index, -10, 20, `Thermal Dev ${latest.thermal_index}°C`, "#00ccff");

    let corrVal = latest.corrosion_risk === "moderate" ? 60 :
                  latest.corrosion_risk === "high" ? 90 : 20;
    let corrColor = latest.corrosion_risk === "high" ? "#ff4444" :
                    latest.corrosion_risk === "moderate" ? "#ffff00" : "#00ff88";

    drawGauge(corrosionCtx, corrVal, 0, 100, `Corrosion Risk: ${latest.corrosion_risk}`, corrColor);

    /* Trend Chart */
    trendChart.data.labels.push("");
    trendChart.data.datasets[0].data.push(latest.degradation_score);
    trendChart.data.datasets[1].data.push(latest.forecast_30d);

    if (trendChart.data.labels.length > 20) {
      trendChart.data.labels.shift();
      trendChart.data.datasets[0].data.shift();
      trendChart.data.datasets[1].data.shift();
    }
    trendChart.update();

    /* Vibration waveform */
    const mag = Math.sqrt(latest.ax**2 + latest.ay**2 + latest.az**2);
    waveformChart.data.labels.push("");
    waveformChart.data.datasets[0].data.push(mag);

    if (waveformChart.data.labels.length > 40) {
      waveformChart.data.labels.shift();
      waveformChart.data.datasets[0].data.shift();
    }
    waveformChart.update();

    /* Stats */
    document.getElementById("total-samples").textContent = stats.samples_total;
    document.getElementById("ping").textContent = Date.now();

  } catch (err) {
    console.log("Error:", err);
  }
}

setInterval(refresh, 1000);
refresh();
</script>

</body>
</html>
Color-coded response reflecting on 3D Model and Built-in RGB LED of ESP32-C6 in real-time
.jpeg)
Dashboard Snapshot
.png)
Structure + Sensing Node