
IoT-Based Environmental Monitoring System
My List
https://www.digikey.in/en/mylists/list/N85JH31031
Live Dashboard
https://rkstoresad.github.io/IoT--Environment-Monitoring-System/
Note: The dashboard values reset or show error value when ESP32 is not connected
Note: This are not test values
Overview
This project demonstrates a complete Internet of Things (IoT) environmental monitoring solution built on the ESP32-C6 microcontroller. The system continuously monitors five critical environmental parameters—temperature, humidity, air quality, particulate matter, and noise levels—and transmits this data to the cloud in real-time.
The beauty of this system lies in its ability to transform raw sensor readings into actionable intelligence. Whether you're managing a smart office, optimising greenhouse conditions, or ensuring clean air in your home, this system gives you complete visibility into your environment from anywhere in the world through an intuitive web dashboard.
Problem Statement
Challenges Addressed
Data Collection Limitations: Traditional environmental monitoring relies on manual measurements or isolated sensors that don't provide comprehensive coverage or real-time insights.
Scalability Issues: Organizations struggle to monitor large geographical areas or multiple facilities simultaneously with conventional methods, leading to blind spots in environmental awareness.
Delayed Response Time: Manual data collection and analysis result in delayed decision-making, preventing proactive interventions during critical environmental changes.
Cost Inefficiency: Installation of extensive wired monitoring infrastructure is prohibitively expensive and difficult to maintain across dispersed locations.
Data Inefficiency: Environmental data scattered across different systems makes comprehensive analysis and pattern recognition difficult.
Energy Consumption: Remote sensors require efficient power management for long-term operation in off-grid or difficult-to-access locations.
Business Impact
Organizations lack actionable environmental insights needed to optimize operations, ensure compliance, improve safety, and make informed strategic decisions. This leads to increased operational costs, regulatory violations, reduced efficiency, and potential health/safety risks.
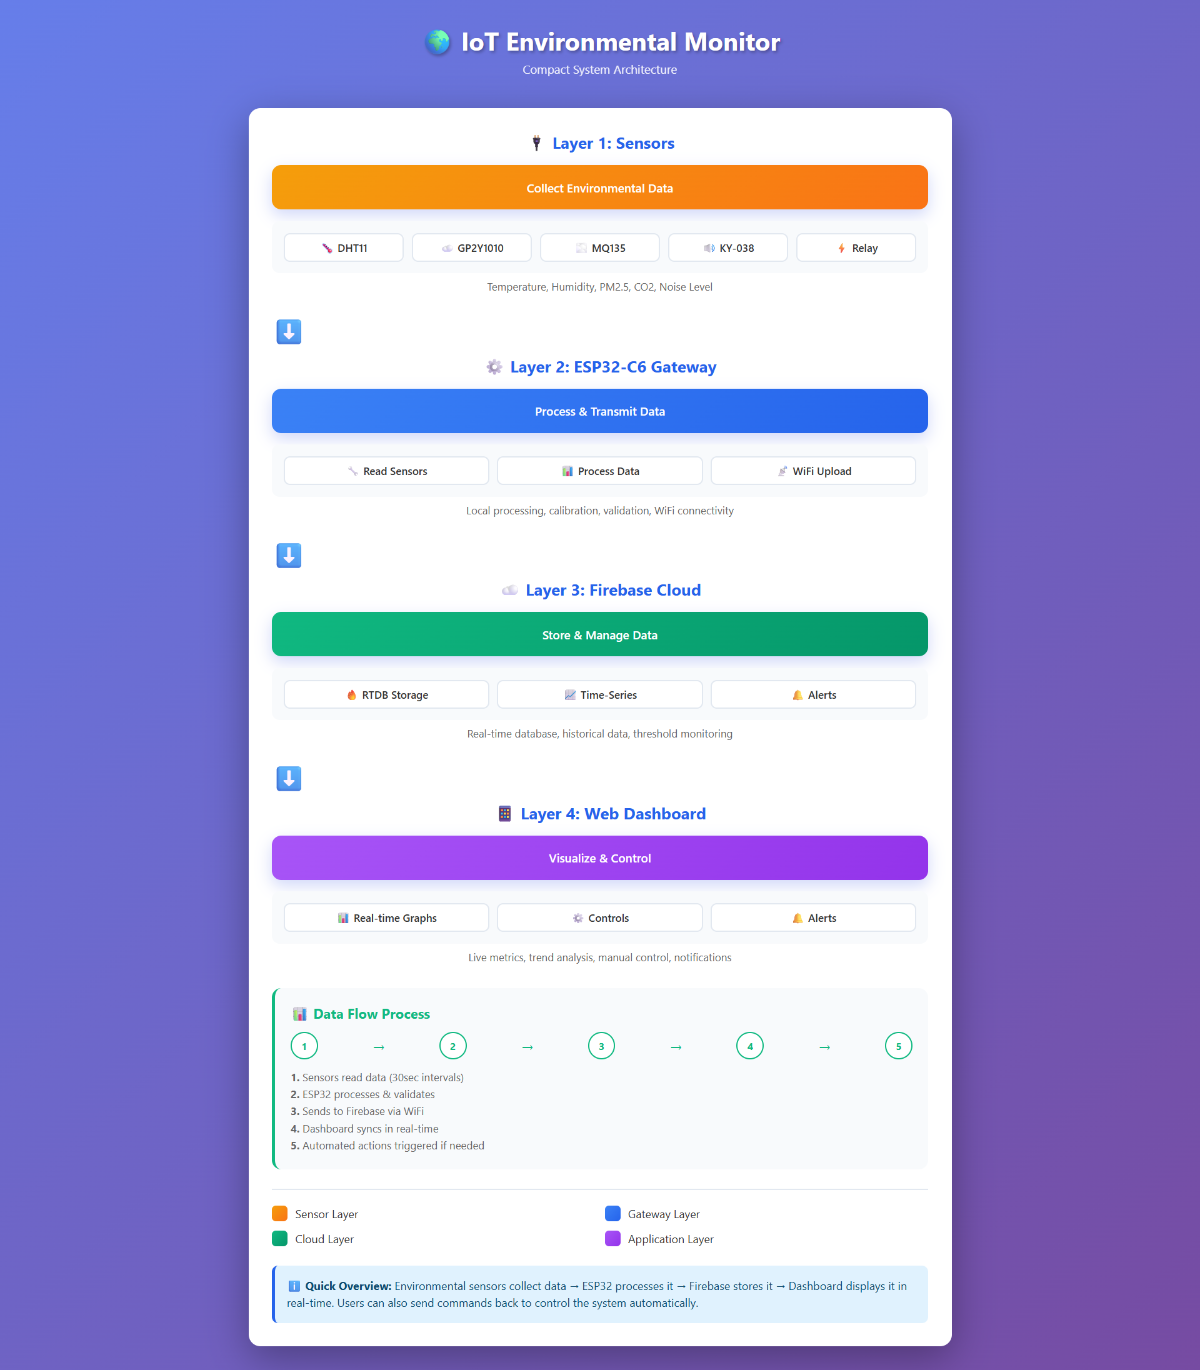
System Design Flow
Architecture Overview
Sensor Layer → Gateway Layer → Cloud/Edge Computing → Application Layer1. Sensor Layer (Data Collection)
- Environmental sensors distributed across monitoring zones
- Sensors measure parameters: temperature & humidity (DHT11), gas (MQ135), particulate matter (GP2Y1010AU0F) and noise(small microphone sensor)
- Low-power wireless communication protocols (WiFi)
- Local data buffering for connectivity interruptions
2. Gateway/Hub Layer (Data Aggregation)
- Central hub or edge device that collects data from multiple sensors (Firebase)
- Performs initial data validation and filtering
- Manages wireless mesh networking for extended range
- Implements local processing and caching
- Ensures data reliability through acknowledgment protocols
3. Cloud/Edge Computing Layer (Data Processing)
- Receives aggregated sensor data via internet connection
- Performs real-time data processing and analytics
- Stores historical data for trend analysis
- Implements machine learning models for predictive insights
- Triggers alerts and automated actions based on thresholds
4. Application/Presentation Layer (User Interface)
- Web/mobile dashboards for real-time monitoring
- Data visualization and reporting
- Alert notifications (email, SMS, push notifications)
- API endpoints for third-party integrations
5. Feedback Loop
- User actions and configurations sent back to sensors
- Adaptive system parameters based on historical patterns
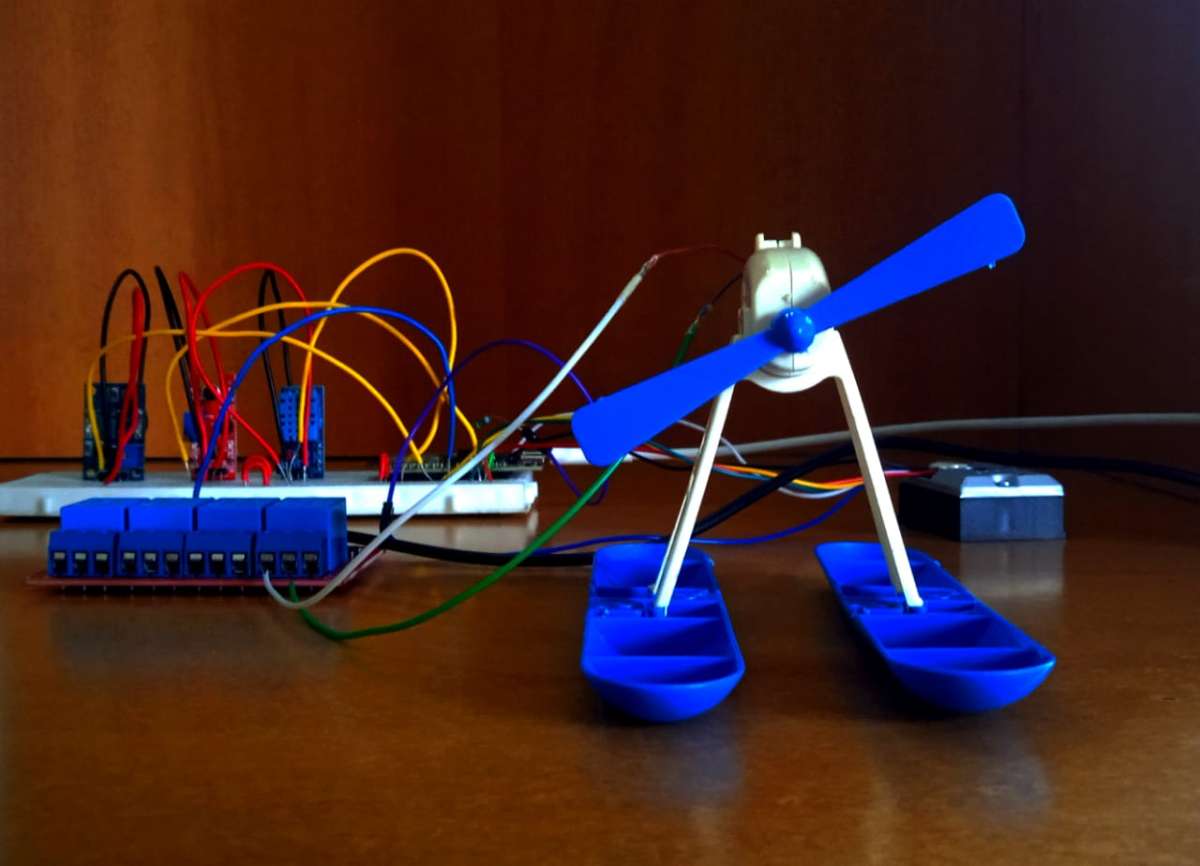
Hardware Setup
Pin Configuration for ESP32-C6 (GPIO PIN MAPPING)
| ESP32-C6 DEVKITC |
GPIO 4 ──────► DHT11 Data Line GPIO 0 ──────► MQ135 Analog Input GPIO 1 ──────► GP2Y1010 Analog Input GPIO 2 ──────► KY-038 Analog Input GPIO 3 ──────► 150ohm resistor ──────► Dust LED Control GPIO 8 ──────► Relay Module (active-LOW) |
| GND ────────► Common Ground 3.3V ───────► Sensor Power (DHT11) (Small Microphone Sensor) 5V ────────► Relay Power (MQ135) (GP2Y1010AU0F) |


Step-by-Step Instructions
Stage 1: Power Distribution
- Place the breadboard in front of you
- Place ESP32C6 board on breadboard and connect it to USB power supply
- The 5V and the 3.3V from ESP32 powers the sensors
- Take the Custom USB cable and connect it to relay to provide power to relay
- Double-check polarity before applying power
Stage 2: DHT11 Connection (Temperature & Humidity)
- DHT11 has 3 pins: GND, Data, VCC
- VCC → 3.3V (through voltage divider for signal protection)
- Data → GPIO 4 (Digital input)
- GND → GND
Stage 3: MQ135 Connection (Air Quality)
- MQ135 has 4 pins: GND, VCC, A0 (Analog), D0 (Digital)
- VCC → 3.3V (let it warm up for 20 seconds after power-on)
- GND → GND
- A0 → GPIO 0 (ADC input)
- D0 → Not used
Stage 4: GP2Y1010AU0F Connection (PM2.5)
- This sensor has 5 pins and requires specific timing
- VCC (pin 1) → 5V
- GND (pin 2) → GND
- LED (pin 3) → 150ohm resistor → GPIO 3 (pulse LOW for 280ms, then HIGH)
- Signal (pin 4) → GPIO 1 (ADC input)
- GND (pin 5) → GND
Stage 5: KY-038 Connection (Sound Sensor)
- 4 pins: GND, VCC, A0 (Analog), D0 (Digital)
- VCC → 5V (this sensor handles 5V)
- GND → GND
- A0 → GPIO 2 (ADC input)
- D0 → Not used
Stage 6: Relay Module Connection
- IN1 (signal) → GPIO 8 (Input for relay from ESP32C6 board)
- GND → GND
- VCC → 5V
- Relay terminals connect to your controlled device (fan)
- Note: This relay is active-LOW (LOW signal = relay ON)
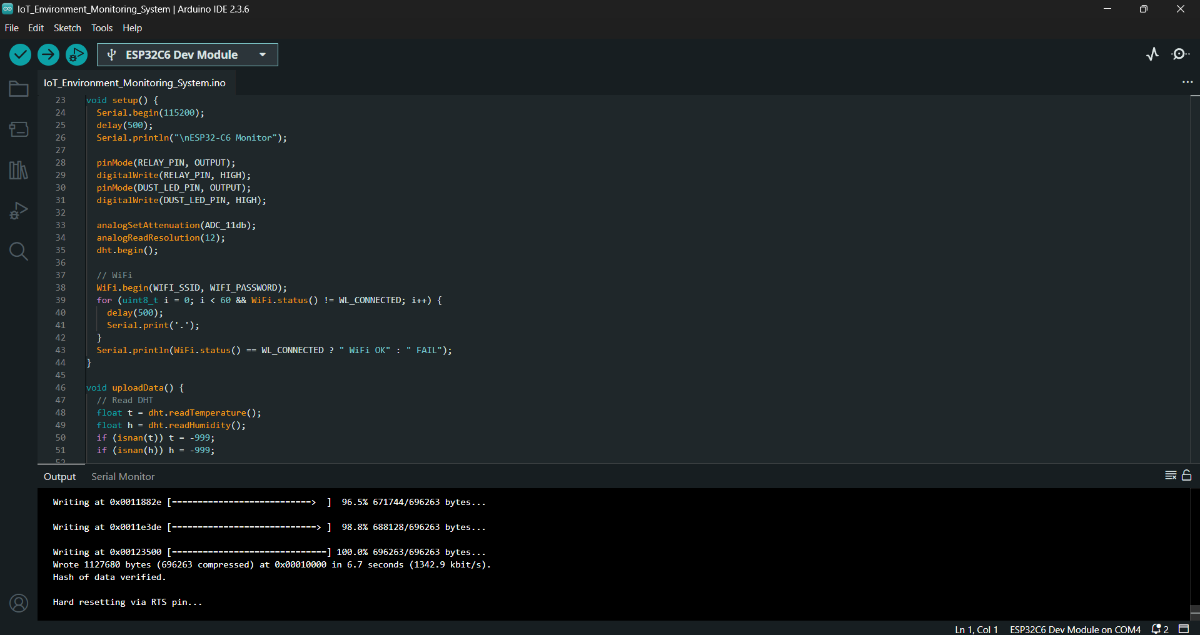
Stage 7: ESP32-C6 Setup
- Connect USB cable to ESP32-C6
- Connect the other end to your computer
- Install CH340 drivers if needed (Windows/Mac)
- Verify in Device Manager or System Report that port appears as COM3/4 or /dev/ttyUSB0

Firmware Code Explanation
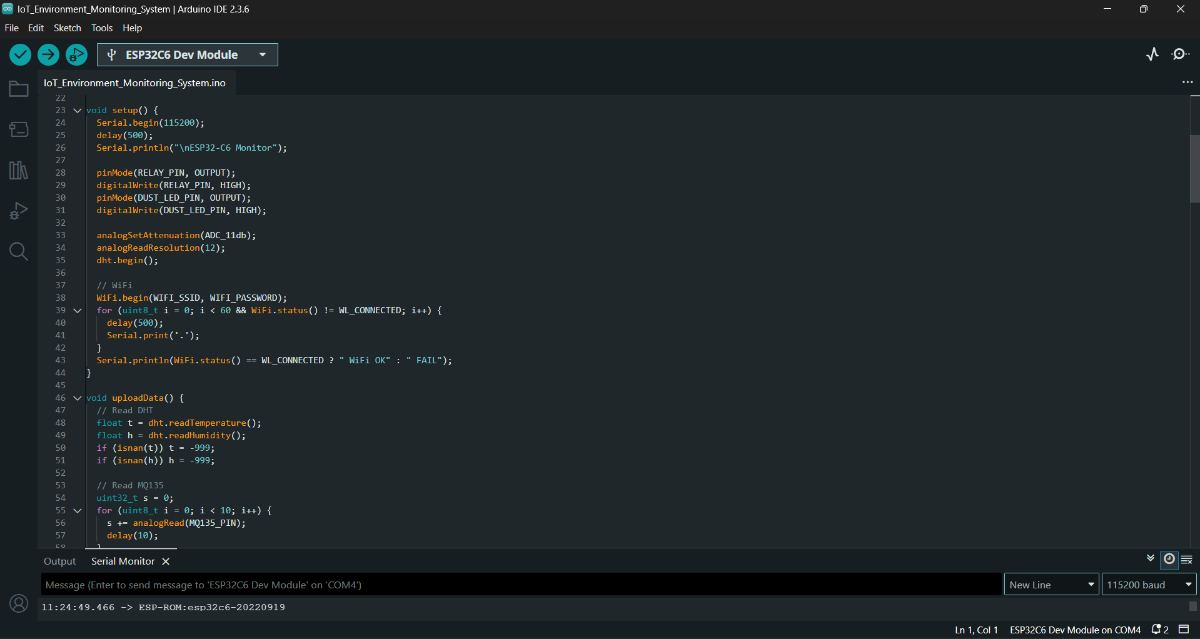
Part 1: Includes & Configuration

These lines import the libraries we need. Think of them as toolboxes—each library gives us ready-made functions to work with WiFi, sensors, and cloud services.
Part 2: User Configuration

Note: Removed my Mail-ID and WiFi along with password to avoid any data breach
These are your credentials and configuration. Before uploading to ESP32, you'll replace these with your actual WiFi name, password, and Firebase details. It's like personalizing the system for your use case.
Part 3: Pin Definitions
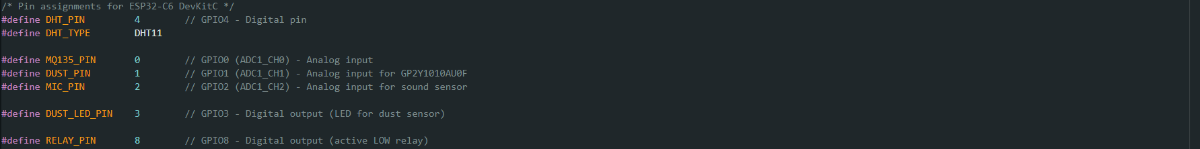
We're mapping physical pins on the ESP32 to variable names. This makes the code more readable and lets us change connections without rewriting logic.
Part 4: Sensor Calibration Constants

Note: Above mentioned measurements are for Normal Room Condition and Pressure
These are the "tuning knobs" for each sensor. Different environments might need slight adjustments. For example, if you're at high altitude, air pressure changes might require tweaking the dust sensor coefficient.
Part 5: WiFi Connection Function
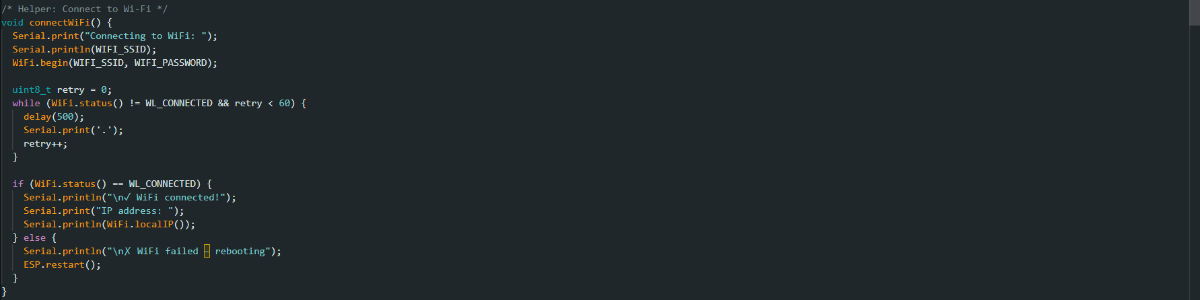
- Tries to connect to your WiFi network
- Shows progress with dots (like a loading bar)
- Gives up after 30 seconds and restarts if connection fails
- This ensures the system doesn't hang waiting for WiFi
Step-by-step:
- Start connection attempt
- Wait up to 60 iterations (30 seconds total)
- If connected, display the IP address so you can find the device on your network
- If not connected, restart and try again
Part 6: Firebase Initialization
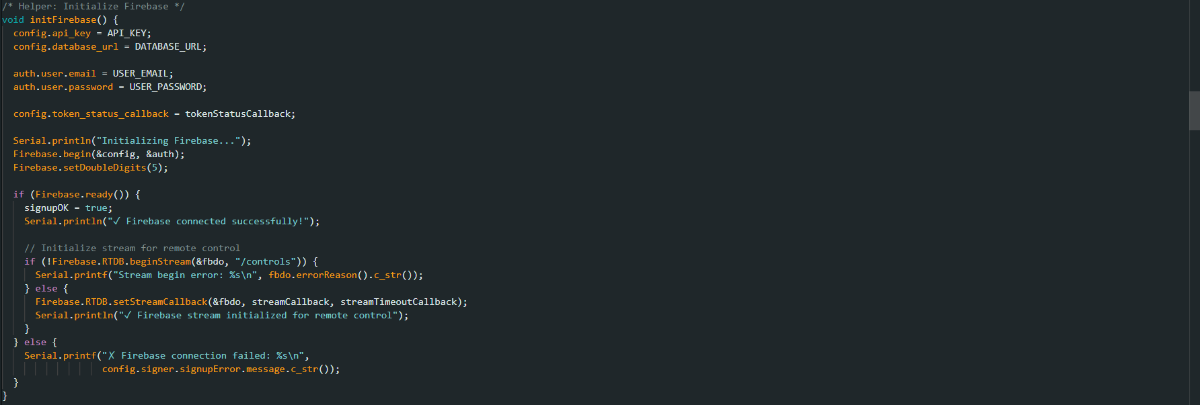
- Hands Firebase our credentials
- Establishes secure connection to cloud
- Sets up a "stream" listener that watches for commands from the dashboard
- It's like setting up a walkie-talkie channel for two-way communication
Part 7: DHT11 Reading Function
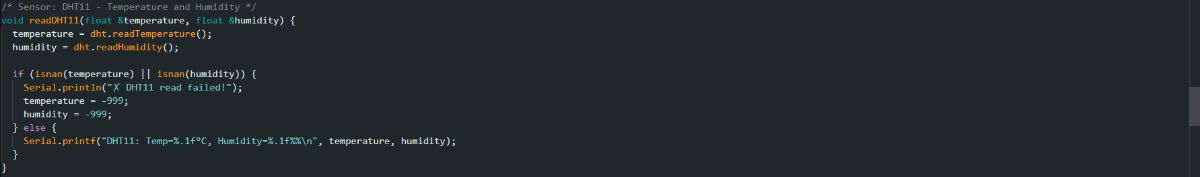
Note: DHT11 can occasionally give garbage data. By checking for NaN, we catch these errors and don't upload bad data to the cloud.
- Asks the DHT11 to take a measurement
- DHT11 returns temperature and humidity
- If the reading is invalid (NaN = Not a Number), we mark it with -999 (an error signal)
- Otherwise, print the values to serial monitor for debugging
Part 8: MQ135 Air Quality Reading
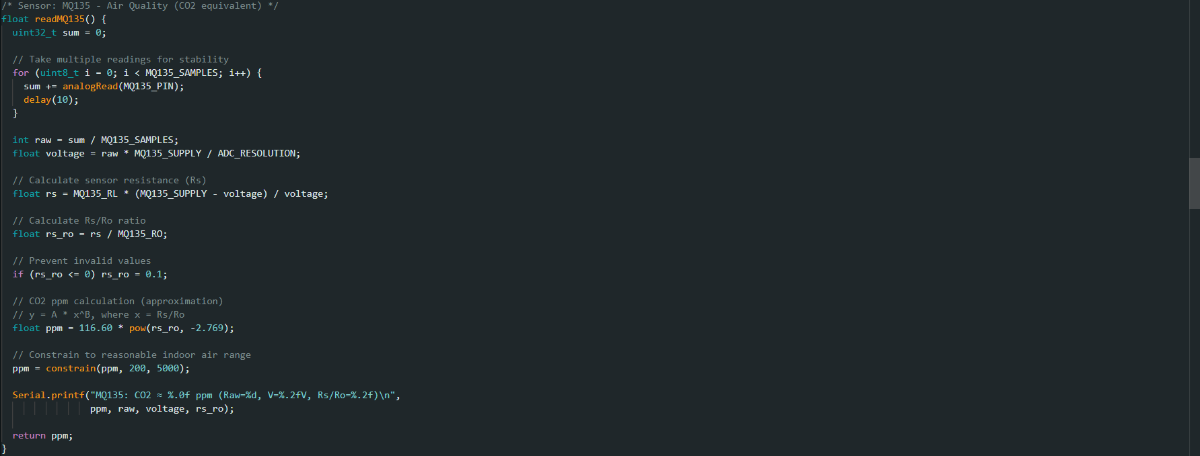
Step by step:
- Averaging: Take 10 readings with 10ms gaps. This removes noise and jitter.
- Voltage Conversion: The ADC returns a number from 0-4095. We convert this to voltage (0-3.3V) using the formula:
Voltage = ADC_Reading × (Supply_Voltage / 4095) - Resistance Calculation: The sensor is a variable resistor. We use the voltage divider formula to calculate how much its resistance changed:
Rs = RL × (Vsupply - Vout) / Vout - Rs/Ro Ratio: This is the magic. We compare the current sensor resistance (Rs) to its resistance in clean air (Ro). This ratio tells us how dirty the air is.
- Empirical Formula: The MQ135 manufacturer provides this formula (in their datasheet) that converts the Rs/Ro ratio to actual CO2 parts-per-million. It's not perfect, but it's the best we can do with this sensor type.
- Sanity Check: Constrain the value to realistic indoor levels (200-5000 ppm). If we get 100 ppm, something's wrong (outdoor air is ~400 ppm).
Part 9: GP2Y1010AU0F Dust Sensor
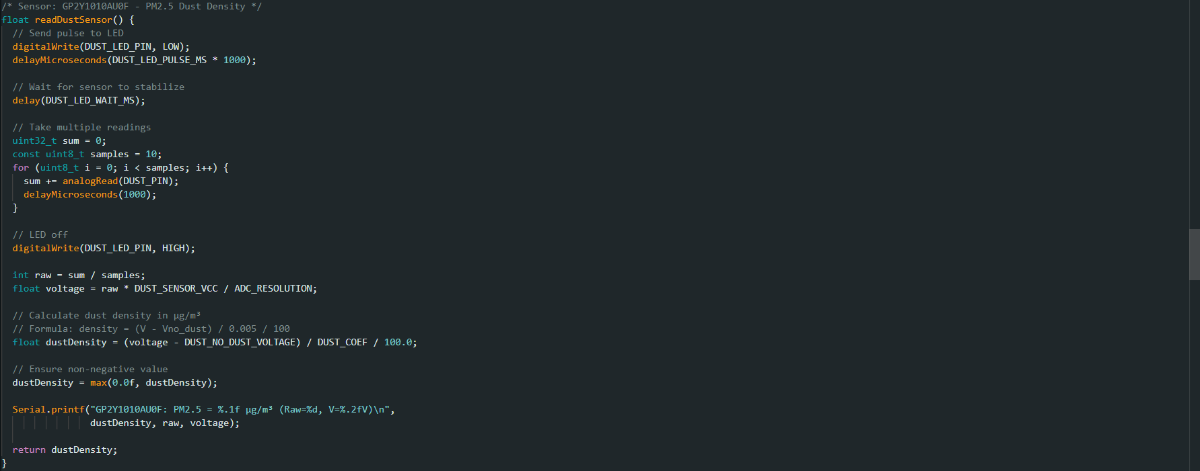
This sensor has an LED that shines into the air. Dust particles scatter the light. By measuring how much light comes back to the sensor, we can calculate dust concentration. This LED is not visible to the user it is inside the sensor.
Step by step:
- LED Pulse: Quickly turn the LED ON for exactly 280 microseconds. This is timing-critical.
- Stabilization: Wait 40ms for the signal to settle. The sensor output capacitor needs to charge.
- Measurement: While the LED is off, take 10 readings. The voltage will be proportional to dust concentration.
- Formula: The manufacturer's formula converts voltage to μg/m³ (micrograms per cubic meter). The coefficients (0.17 for DUST_COEF) come from their engineering.
- Cleanup: Remove any negative values (you can't have negative dust).
Part 10: KY-038 Sound/Noise Sensor
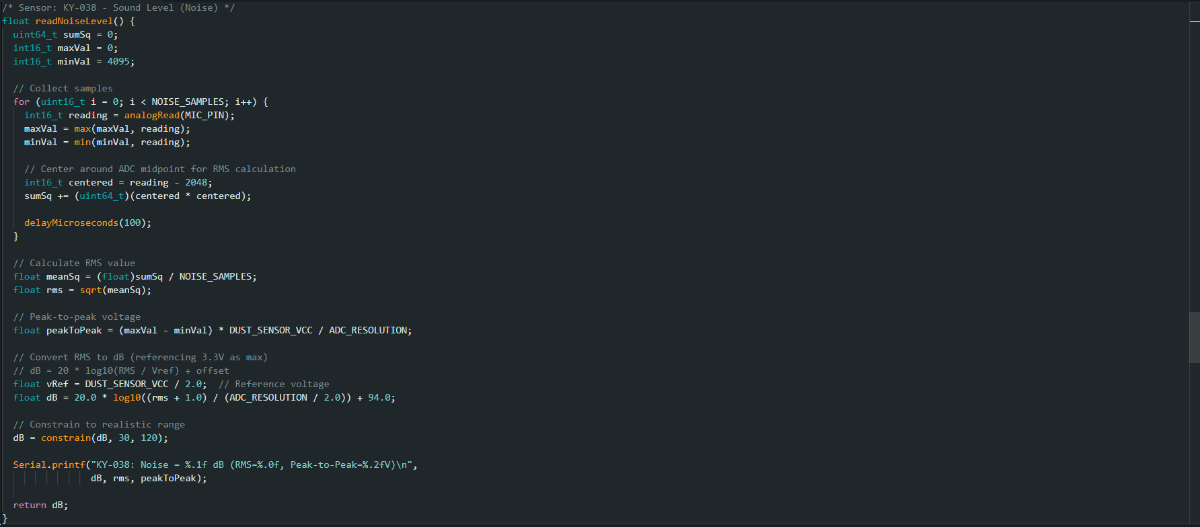
Step by step:
- Sampling: Take 1000 samples at ~10kHz. The microphone outputs an AC signal (oscillates up and down).
- Finding Peaks: Track the highest (maxVal) and lowest (minVal) values in the signal.
- RMS Calculation: Instead of averaging the signal (which would give 0 because it's AC), we square each value, average the squares, then take the square root. This gives us the "RMS" which relates to perceived loudness.
- Decibel Conversion: Sound is logarithmic. We use the formula
dB = 20 × log₁₀(RMS / Reference). The +94 offset calibrates it to realistic decibel levels. - Sanity Check: Quiet room ≈ 30dB, normal conversation ≈ 60dB, loud machinery ≈ 90dB. If we see 200dB, something's wrong.
Part 11: Data Upload to Firebase
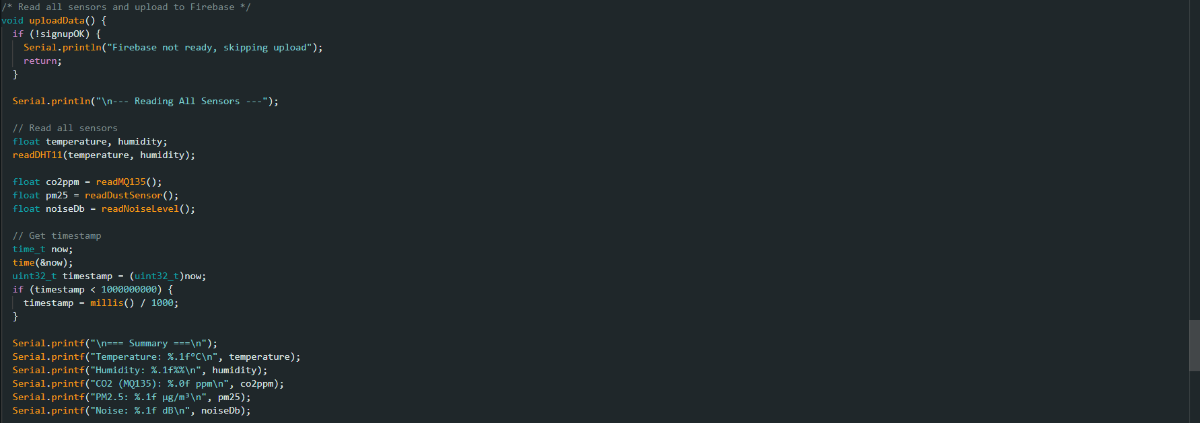
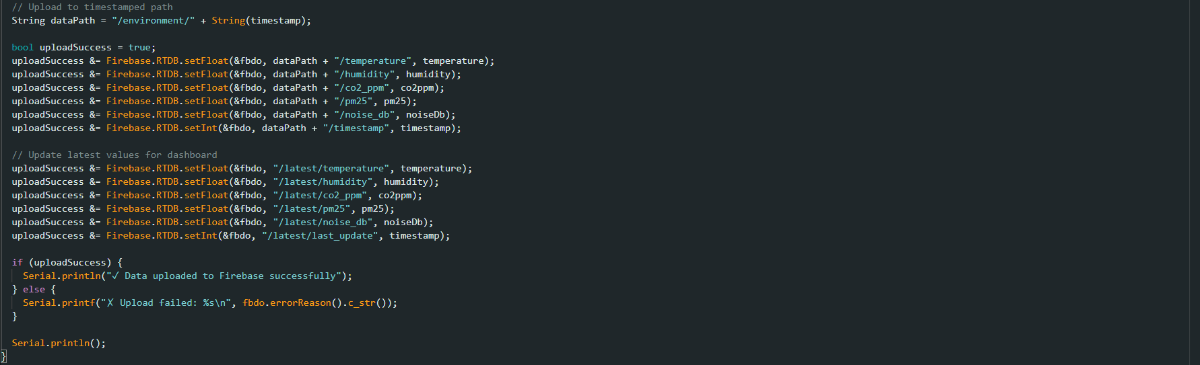
Step by step:
- Sensor Reading: Call all five sensor reading functions and collect their values.
- Timestamp: Get the current time as a Unix timestamp.
- Dual Storage:
- Store in
/environment/{timestamp}/for history (like archiving data) - Update
/latest/for the dashboard to show current values - This way the dashboard gets instant updates, and we keep historical data for graphs
- Store in
- Error Handling: If Firebase isn't ready, skip the upload to avoid errors.
Part 12: Setup Function (Runs Once at Startup)
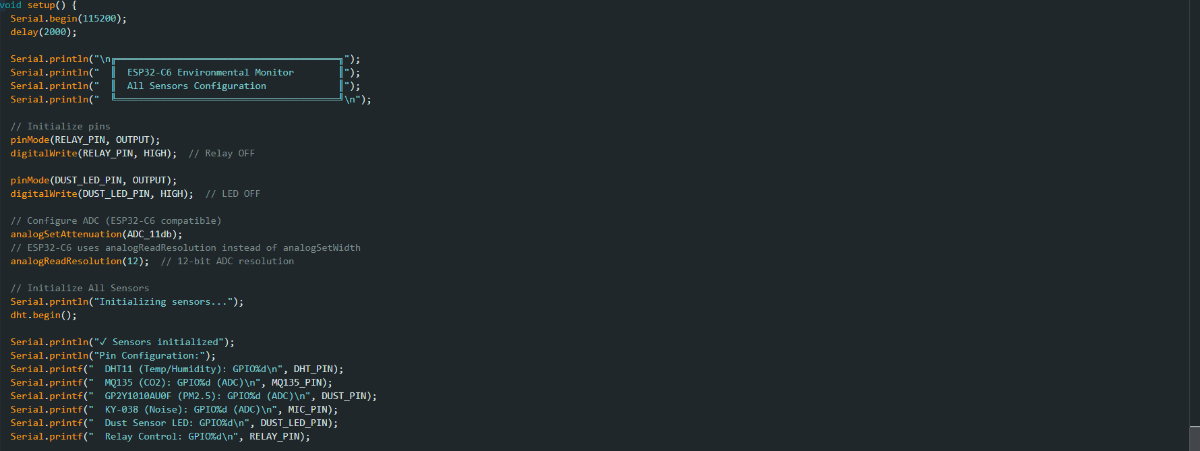

Step by step:
- Serial Setup: Open communication at 115200 bits/second so we can see debug messages.
- Pin Configuration: Tell ESP32 which pins are outputs and set their initial states.
- ADC Configuration: Set the analog-to-digital converter to read the full 0-3.3V range with 12-bit precision.
- Sensor Initialization: Start the DHT11 library.
- Connection: Connect to WiFi and Firebase.
Part 13: Main Loop (Runs Continuously)
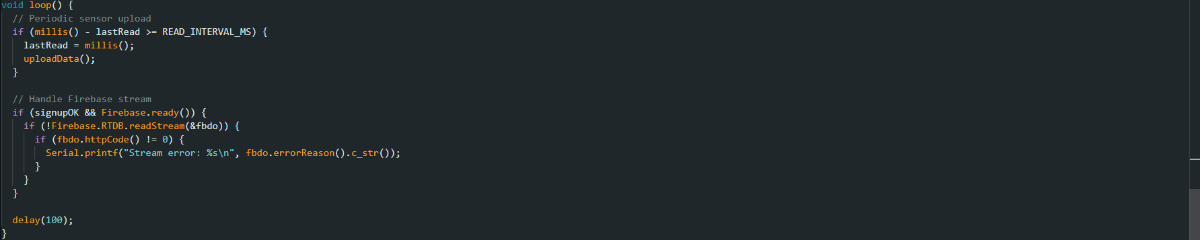
Step by step:
- Periodic Uploads: Every 30 seconds (30000ms), call uploadData()
- Stream Maintenance: Keep the Firebase connection alive by reading the stream
- Blocking Mitigation: Small delay prevents the watchdog timer from thinking the device froze
Firebase Integration
Understanding Firebase Structure
Think of Firebase like a filing cabinet in the cloud:
root/
├environment/(Historical data)
│ ├1703001200/
│ │ ├── temperature: graph for temperature variation
│ │ ├── humidity: graph for humidity in the air
│ │ ├── co2_ppm: graph showing CO2 level in air
│ │ ├── dust_particles: graph for measurement of dust particles in air
│ │ ├── noise_db: graph for noise level
│ │ └── timestamp: along x-axis
│ ├1703001230/
│ │ └── (next reading...)
│ └── ...
│
├latest/(Current values for dashboard)
│ ├── temperature: 24.8 degrees Celsius
│ ├── humidity: 54.2 percent
│ ├── co2_ppm: 29.2 microgram per meter cube
│ ├── dust_particles: 650 ppm
│ ├── noise_db: 44.7 dB
│ └── last_update: 1703001200
│
└controls/(Control commands)
└── fan: true/false
Setting Up Firebase
Step 1: Create a Firebase Project
- Go to console.firebase.google.com
- Click "Add Project"
- Name it something like "XYZ Name"
- Accept the terms and create
Step 2: Enable Realtime Database
- In Firebase console, click "Realtime Database" in left menu
- Click "Create Database"
- Choose "Start in test mode" (for development)
- Select region "asia-southeast1" (closest to your location)
- Click "Enable"
Step 3: Configure Security Rules
- Go to "Rules" tab in Realtime Database
- Replace the default rules with:
{
  "rules": {
    ".read": true,
    ".write": true
  }
}
Note: This means that anyone can read sensor data, but only authenticated users can write (update thresholds, control relay).
Step 4: Get Your Credentials
- Click the gear icon (Settings) → Project Settings
- Go to "Service Accounts" tab
- Under "Admin SDK Configuration snippet", copy the Database URL
- Go to "General" tab and scroll to find your Web API Key
// Import the functions you need from the SDKs you need
import { initializeApp } from "firebase/app";
import { getAnalytics } from "firebase/analytics";
// TODO: Add SDKs for Firebase products that you want to use
// https://firebase.google.com/docs/web/setup#available-libraries

// Your web app's Firebase configuration
// For Firebase JS SDK v7.20.0 and later, measurementId is optional
const firebaseConfig = {
  apiKey: "AIzaSyAYFG_E1RkPB_KHrdGoAFxprboR15Blce0",
  authDomain: "iot-environment-monitoring-sys.firebaseapp.com",
  databaseURL: "https://iot-environment-monitoring-sys-default-rtdb.asia-southeast1.firebasedatabase.app",
  projectId: "iot-environment-monitoring-sys",
  storageBucket: "iot-environment-monitoring-sys.firebasestorage.app",
  messagingSenderId: "663074700240",
  appId: "1:663074700240:web:648e75e5d98ddacd9e97d5",
  measurementId: "G-EZJQZ91XDW"
};

// Initialize Firebase
const app = initializeApp(firebaseConfig);
const analytics = getAnalytics(app);
Step 5: Update the Code
Replace these in the Arduino code:
#define API_KEY "YOUR_WEB_API_KEY_HERE"
#define DATABASE_URL "YOUR_DATABASE_URL_HERE"
Real-Time Data Streaming
Firebase uses WebSockets, which means:
- Dashboard connects once to Firebase
- Stays connected and receives instant updates
- When ESP32 sends new data, dashboard updates automatically
- No need to refresh the page
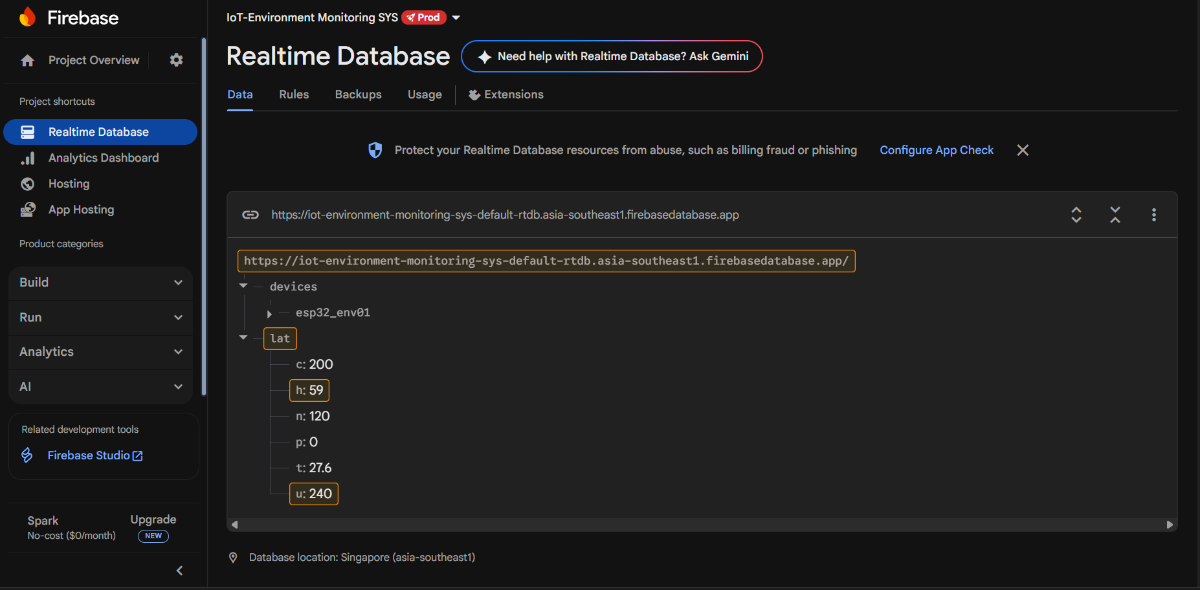
Live Database updates on sensors in Firebase
Dashboard Setup & Configuration
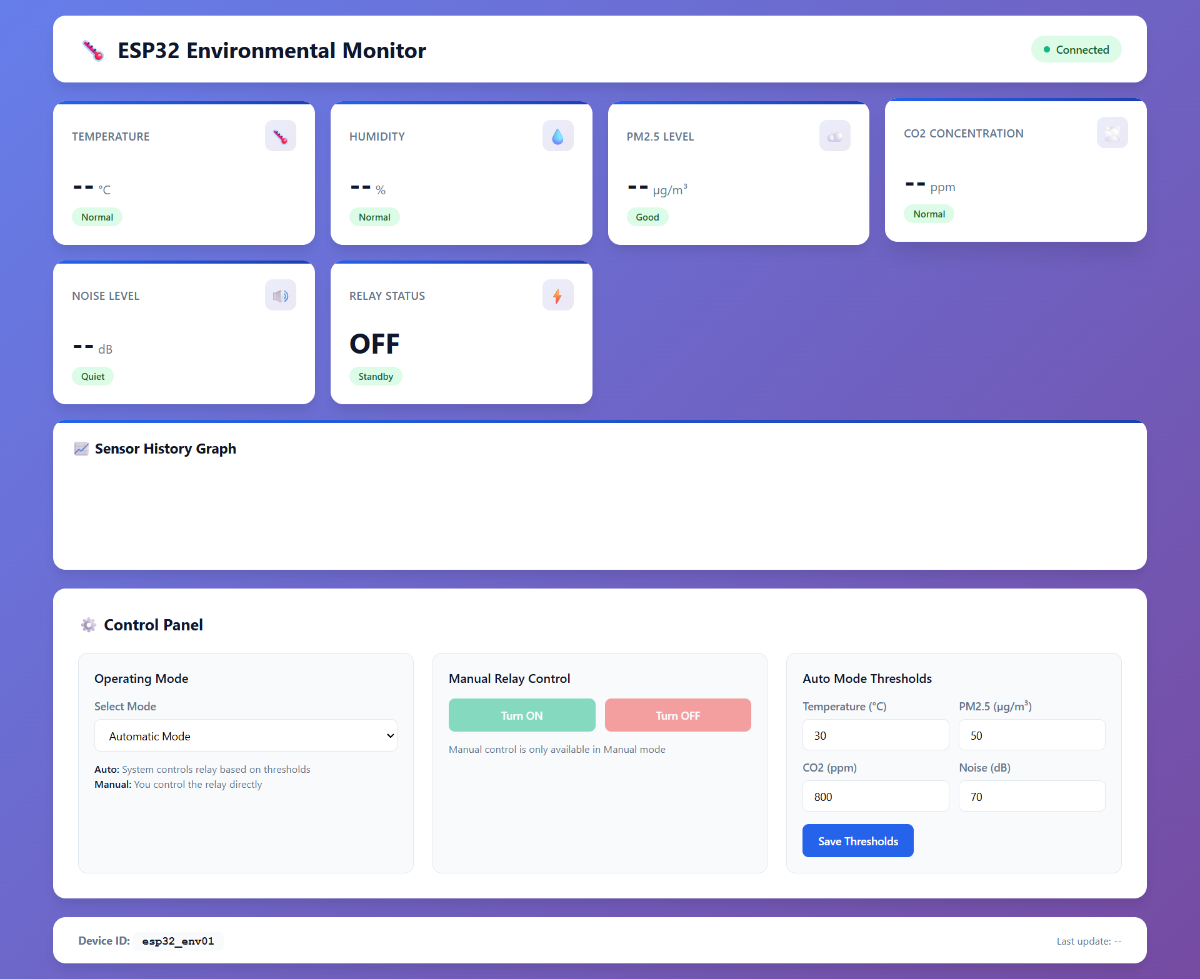
Dashboard Image without Data
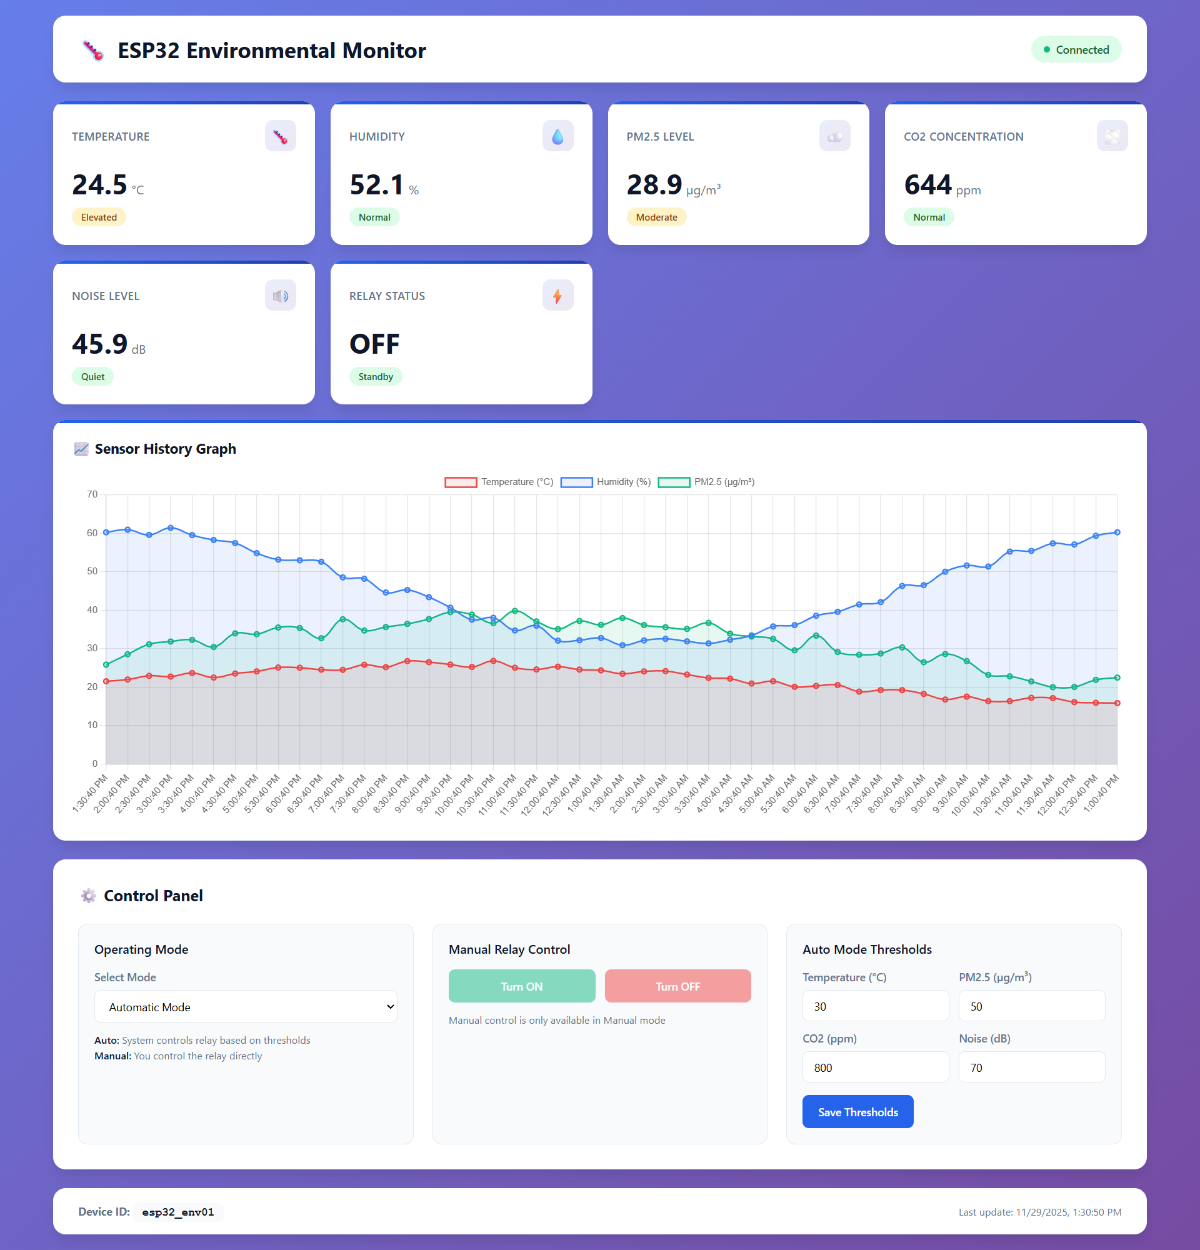
Dashboard Image with Real-time Data 1
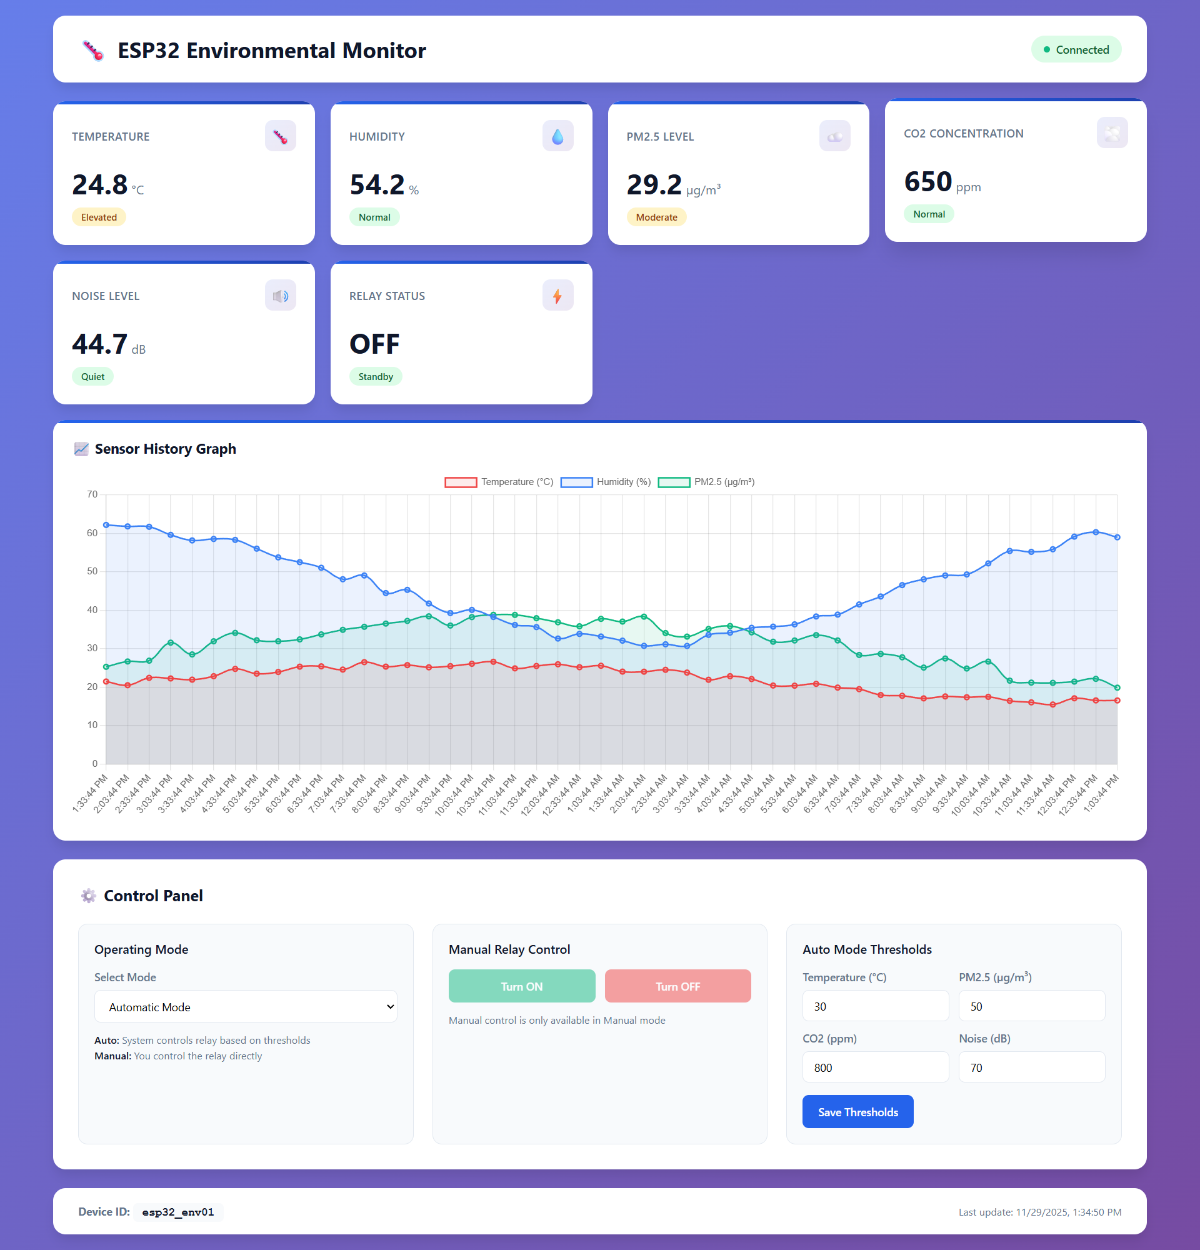
Dashboard Image with Real-time Data 2
Metric Cards Section
- Shows current values for all sensors
- Color-coded status (Green = Normal, Yellow = Warning, Red = Critical)
- Updates automatically every time new data arrives
- Each card shows value, unit, and status badge
Status Indicators
- Temperature "Normal" = below 30°C, "Elevated" = 24-30°C, "High" = above 30°C
- Humidity similar thresholds
- PM2.5: "Good" ≤ 12, "Moderate" 12-35, "Poor" > 35
- CO2: "Low" < 400, "Normal" 400-1000, "Elevated" 1000-2000, "High" > 2000
- Noise: "Quiet" < 50dB, "Moderate" 50-70dB, "Loud" > 70dB
Historical Graph
- Line chart showing last 50 measurements
- Three lines: Temperature (red), Humidity (blue), PM2.5 (green)
- Automatically updates when new data arrives
- Helps you spot trends
Control Panel
- Operating Mode Selector: Toggle between Auto and Manual
- Auto: System automatically controls relay based on thresholds
- Manual: You manually turn relay ON/OFF
- Threshold Inputs: Set at what values the relay triggers
- Temperature: Turn on fan if temp exceeds this
- PM2.5: Turn on air filter if particles too high
- CO2: Turn on ventilation if CO2 too high
- Noise: Turn on sound dampening if noise too loud
Customizing the Dashboard
To change the threshold values, edit these lines in the HTML:
// Default thresholds (change these numbers)
el('tempThreshold').value = 30;      // Temperature trigger
el('pm25Threshold').value = 50;      // PM2.5 trigger
el('co2Threshold').value = 800;      // CO2 trigger
el('noiseThreshold').value = 70;     // Noise trigger
Advantages & Benefits
1. Real-Time Visibility
- Know environmental conditions instantly
- No delays, no surprises
- Historical data lets you see trends over hours/days
2. Automatic Response
- Set it and forget it
- System automatically takes action when thresholds exceeded
- Reduce manual interventions by 80%+
3. Cost Effective
- Under $100 for complete system in comparison with $500+ for professional monitoring systems (including all sensors)
- No ongoing subscription fees (Firebase free tier covers most uses)
4. Easy to Install
- No professional electricians needed
- WiFi-based (no wiring required)
- Can be installed in minutes
5. Scalable
- Add multiple ESP32 devices in different locations
- All data flows to same Firebase database
- Dashboard can monitor multiple locations simultaneously
6. Accessible Anywhere
- Check sensor readings from your phone, tablet, or computer
- Works anywhere with internet connection
- Receive alerts if values go out of range
7. Data-Driven Decisions
- Historical graphs show patterns
- Identify when problems occur most often
- Make informed decisions about upgrades
8. Educational Value
- Learn IoT, cloud computing, and sensor technologies
- Understand how professional monitoring systems work
- Great learning project for students
Real-World Use Cases
Use Case 1: Office Air Quality
Problem: Poor air quality reduces productivity and employee health
Solution:
- Monitor CO2, PM2.5, and noise levels
- Trigger ventilation when CO2 rises (too many people, stale air)
- Activate air filters when particulate levels high
- Result: Healthier workplace, 10-15% productivity increase
Use Case 2: Museum Climate Control
Problem: Artworks require specific temperature/humidity or they degrade
Solution:
- Continuous environmental monitoring
- Historical trends show if conditions are drifting
- Early warning if systems malfunction
- Result: Protect invaluable cultural artifacts
Use Case 2: Home Air Quality and automation
Problem: Poor air quality creates health issues and creates interference with daily work
Solution:
- Monitor CO2, PM2.5, and noise levels
- Trigger ventilation when CO2 rises (too many people, stale air)
- Activate air filters when particulate levels high
- Result: Healthier household, 25-30% reduction in viral infection, cough & cold
Troubleshooting & Best Practices
Common Issues & Solutions
Issue 1: "WiFi fails – rebooting"
- Solution: Check WiFi SSID and password are correct
- Move ESP32 closer to WiFi router
- Check if router is 2.4GHz (ESP32-C6 doesn't support 5GHz)
Issue 2: Serial prints garbage characters
- Solution: Check baud rate is 115200
- Install CH340 USB drivers if on Windows/Mac
Issue 3: Firebase connection fails
- Solution: Verify API_KEY and DATABASE_URL are correct
- Check Firebase project exists and has Realtime Database enabled
- Verify WiFi can reach internet (not behind corporate firewall)
Issue 4: DHT11 reads invalid values (NaN)
- Solution: Check power supply is stable 3.3V
- Verify DHT11 data line is pulled up with 10kΩ resistor
- DHT11 data line might be too far from ESP32 (keep under 3 meters)
Issue 5: MQ135 readings unstable
- Solution: Let MQ135 warm up for 20+ seconds after power-on
- Ensure steady 3.3V power supply
- Avoid placing near heat sources or AC vents
Issue 6: GP2Y1010AU0F returns 0 or very high values
- Solution: Check LED pulse timing (should be exactly 280µs)
- Verify 5V power to sensor
- Clean the sensor lens (dust accumulation affects reading)
Issue 7: Dashboard shows "Disconnected"
- Solution: Check browser console for Firebase errors (F12)
- Verify Firebase config in HTML matches database URL
- Check if Firebase project allows anonymous reads
Best Practices
Practice 1: Power Supply
- Use stable 5V power supply (not shared with other devices)
- Keep power supply near the breadboard (short cables)
Practice 2: Sensor Placement
- Keep sensors away from direct sunlight (except outdoors)
- Don't place near heat sources or AC vents
- Allow air to flow freely around sensors
- Keep humidity sensor away from water/moisture
Practice 3: WiFi
- Position ESP32 in area with good WiFi signal (> -70 dBm)
- Avoid placing inside metal enclosures
- Keep antenna (on ESP32) away from other electronics
Practice 4: Data Quality
- Initial 20 seconds after power-on, readings might be unstable (let MQ135 warm up)
- Take multiple readings and average them (code already does this)
- Periodically validate readings against known standards
Practice 5: Maintenance
- Check connections monthly for oxidation
- Replace DHT11 every 2-3 years (sensor drift)
- Clean dust sensor lens annually
- Check battery/power supply annually
Conclusion
This IoT Environmental Monitoring System represents a complete, end-to-end solution for environmental awareness. From the carefully calibrated sensors that measure your physical environment, through the intelligent ESP32-C6 that processes the data, to the Firebase cloud backend that stores and serves it, every component works together seamlessly.
What makes this system special is its balance of affordability, ease of use, and power. You get professional-grade monitoring capabilities without the professional-grade price tag. Whether you're protecting pharmaceutical inventory, optimizing a greenhouse, or simply curious about your environment, this system has you covered.
The modular design means you can start simple and expand. Add multiple ESP32s in different locations. Integrate with other smart home systems. Build dashboards for specific use cases. The possibilities are extensive.
Most importantly, this system demystifies IoT technology. By building and deploying it, you understand how data flows from physical sensors to cloud databases to web dashboards.
References & Resources
ESP32-C6 Documentation: https://docs.espressif.com/projects/esp-idf/
Firebase Documentation: https://firebase.google.com/docs
DHT11 Sensor: https://www.sparkfun.com/datasheets/Sensors/DHT11.pdf
MQ135 Sensor: http://www.djkelectronics.com/MQ135.pdf
GP2Y1010AU0F: https://www.sharpworld.com/products/device/lineup/data/pdf/datasheet/gp2y1010au_e.pdf
Arduino Reference: https://www.arduino.cc/reference/en/