TejasArk: Where Solar Energy Monitoring Meets Artificial Intelligence
While panels generate electricity efficiently, the intelligence required to understand, predict, and optimize their performance is often missing.
TejasArk was envisioned as a bridge between renewable energy and intelligent computing.
Built as an AI-driven solar analytics platform, TejasArk transforms conventional solar monitoring into a predictive and insight-oriented experience. Rather than merely displaying numbers on a screen, the system interprets data, uncovers patterns, and provides meaningful forecasts that help users make informed energy decisions.
At its core, TejasArk continuously gathers operational parameters from solar installations and processes them through machine learning models hosted on a Flask-based AI server. These models analyze trends, estimate future power generation, and identify performance deviations that may otherwise go unnoticed.
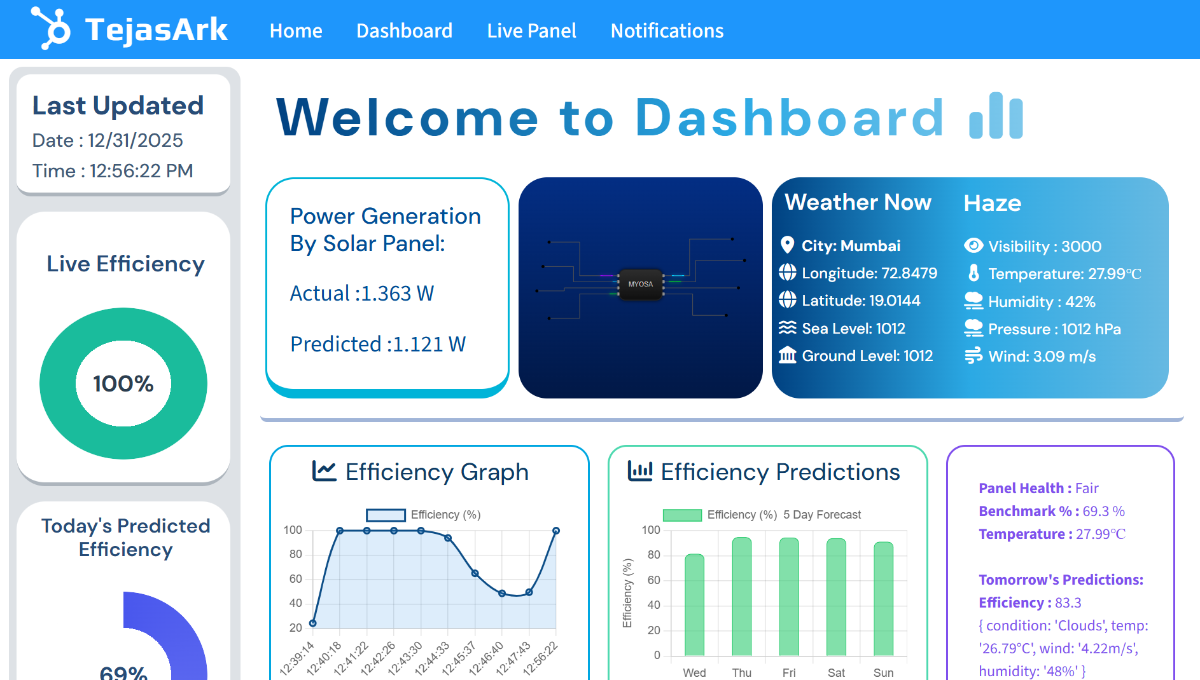
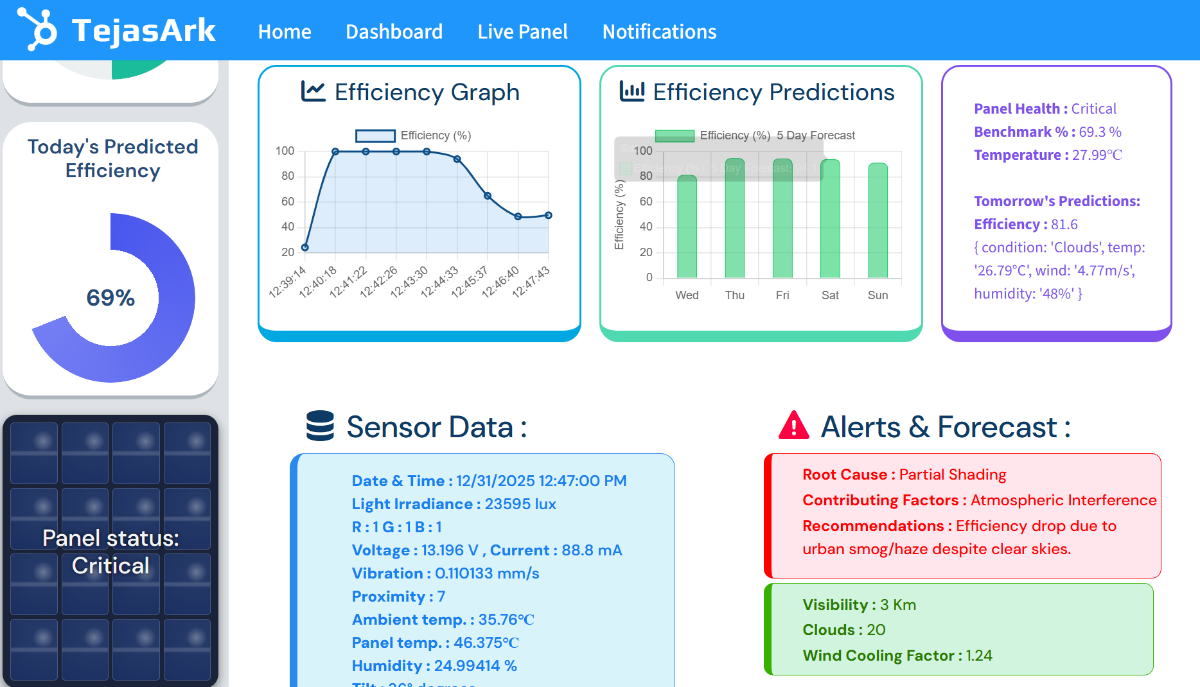
The platform presents these insights through an interactive dashboard designed to convert complex datasets into actionable information. Whether it is understanding generation trends, evaluating system efficiency, or anticipating future output, TejasArk enables users to view their solar infrastructure from a new perspective.
Highlights of the System
• Intelligent prediction of solar power generation.
• Real-time performance visualization.
• AI-powered analysis of operational data.
• Cloud-enabled accessibility and monitoring.
• Interactive dashboard for decision support.
• Scalable architecture suitable for diverse deployment environments.
Engineering with Purpose
TejasArk was developed with the belief that renewable energy systems should not only generate power but also generate knowledge. By integrating artificial intelligence with solar technology, the project creates an ecosystem capable of learning from data and assisting users in maximizing the value of their installations.
Bill of Materials (BOM) – TejasArk AI Solar Intelligence System
| Sr. No. | Component | Model / Type | Qty |
|---|---|---|---|
| 1 | Microcontroller | ESP32 Dev Board | 1 |
| 2 | OLED Display | SSD1306 OLED Display (I2C) | 1 |
| 3 | Voltage & Current Sensor | INA219 | 1 |
| 4 | Temperature, Humidity & Pressure Sensor | BME280 | 1 |
| 5 | Atmospheric Pressure Sensor | BMP180 | 1 |
| 6 | Ambient Light Sensor | BH1750 Lux Sensor | 1 |
| 7 | RGB Color & Proximity Sensor | APDS9960 | 1 |
| 8 | Accelerometer & Gyroscope | MPU6050 | 1 |
| 9 | Panel Temperature Sensor | DS18B20 Waterproof Sensor | 1 |
| 10 | Dust Sensor | GP2Y1010AU0F PM2.5 Sensor | 1 |
| 11 | Solar Panel | 12V Poly/Mono Crystalline Panel | 1 |
| 12 | Solar Charge Controller | PWM/MPPT Controller | 1 |
| 13 | Battery | 12V Rechargeable Battery (7–12Ah) | 1 |
| 14 | DC-DC Buck Converter | 12V to 5V Converter | 1 |
| 15 | Breadboard / Prototype PCB | Circuit Assembly | 1 |
| 16 | Jumper Wires & Connectors | Assorted | As Required |
| 17 | Power Supply & Protection Circuit | Fuse/Terminal Blocks | 1 Set |
Sensor Parameters Monitored
- Solar Voltage - Measured using INA219.
- Solar Current - Measured using INA219.
- Solar Power Estimation - Calculated from INA219 voltage and current readings.
- Ambient Temperature - Measured using BME280.
- Ambient Humidity - Measured using BME280.
- Atmospheric Pressure - Measured using BMP180/BME280.
- Panel Surface Temperature - Measured using DS18B20 temperature sensor.
- Light Intensity (Lux) - Measured using BH1750 light sensor.
- Dust Concentration - Measured using PM2.5 dust sensor.
- RGB Reflection Analysis - Measured using APDS9960 color sensor.
- Object Proximity Detection - Measured using APDS9960 proximity sensor.
- Solar Panel Tilt Angle - Determined using MPU6050 accelerometer and gyroscope.
- Vibration and Tampering Detection - Monitored using MPU6050 motion sensor.
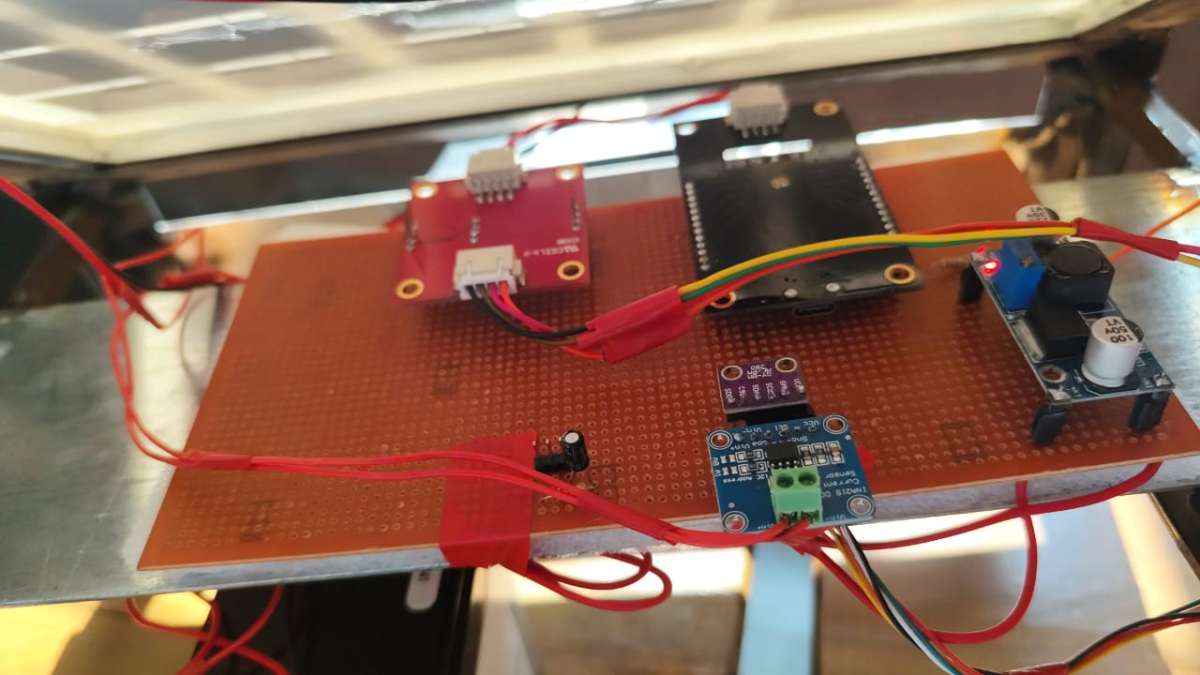
Assembly Procedure
Step 1: Sensor-to-ESP32 Integration
ESP32 was selected as the central controller for data acquisition and wireless communication. All sensing modules were connected to the ESP32 using appropriate communication interfaces such as I²C, analog, and digital GPIO pins.
- INA219 was connected for monitoring solar voltage and current.
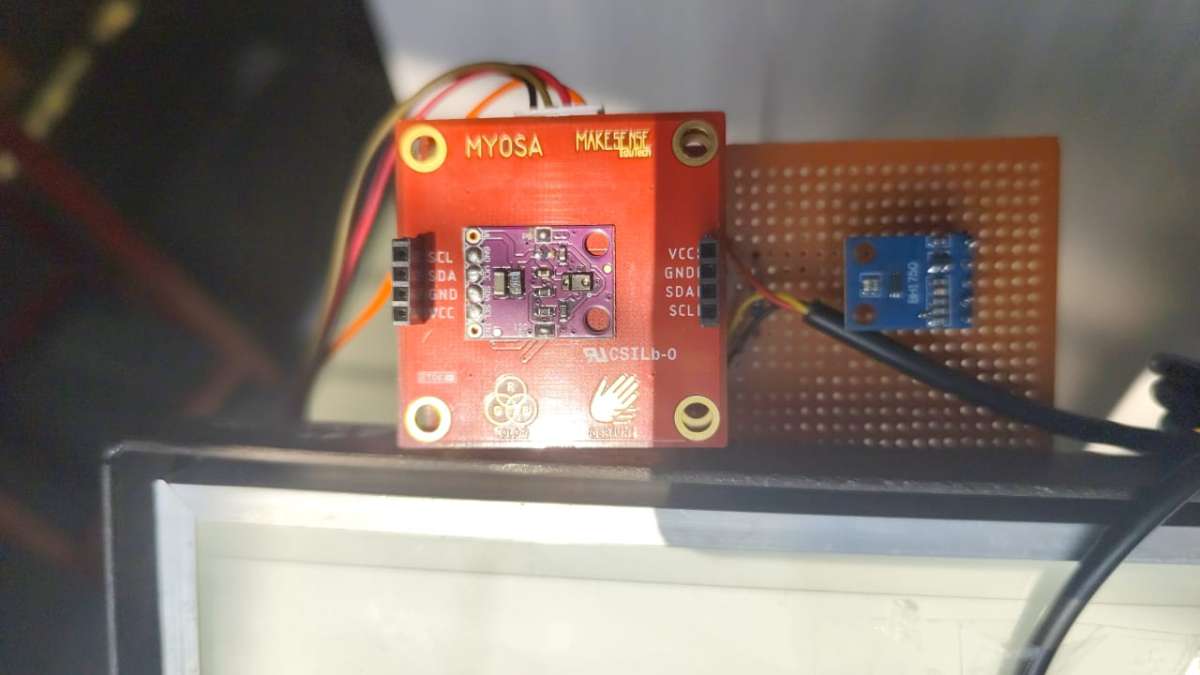
- BME280 and BMP180 were connected via the I²C bus to measure environmental conditions.
- BH1750 was integrated to monitor ambient light intensity incident on the solar panel.
- APDS9960 was connected to capture RGB reflection data and object proximity information.
- MPU6050 was interfaced with the ESP32 to measure panel inclination and detect vibrations or tampering.
- DS18B20 was connected through a One-Wire interface to monitor solar panel surface temperature.
- The PM2.5 dust sensor was connected through an analog input channel for dust concentration measurement.
The OLED display was interfaced through I²C to provide real-time system status and AI diagnostics.
Step 2: Verification of Sensor Operation
After wiring, each sensor was tested individually to verify communication with the ESP32 and ensure accurate data acquisition. Sensor readings were validated through serial monitoring and OLED display outputs.
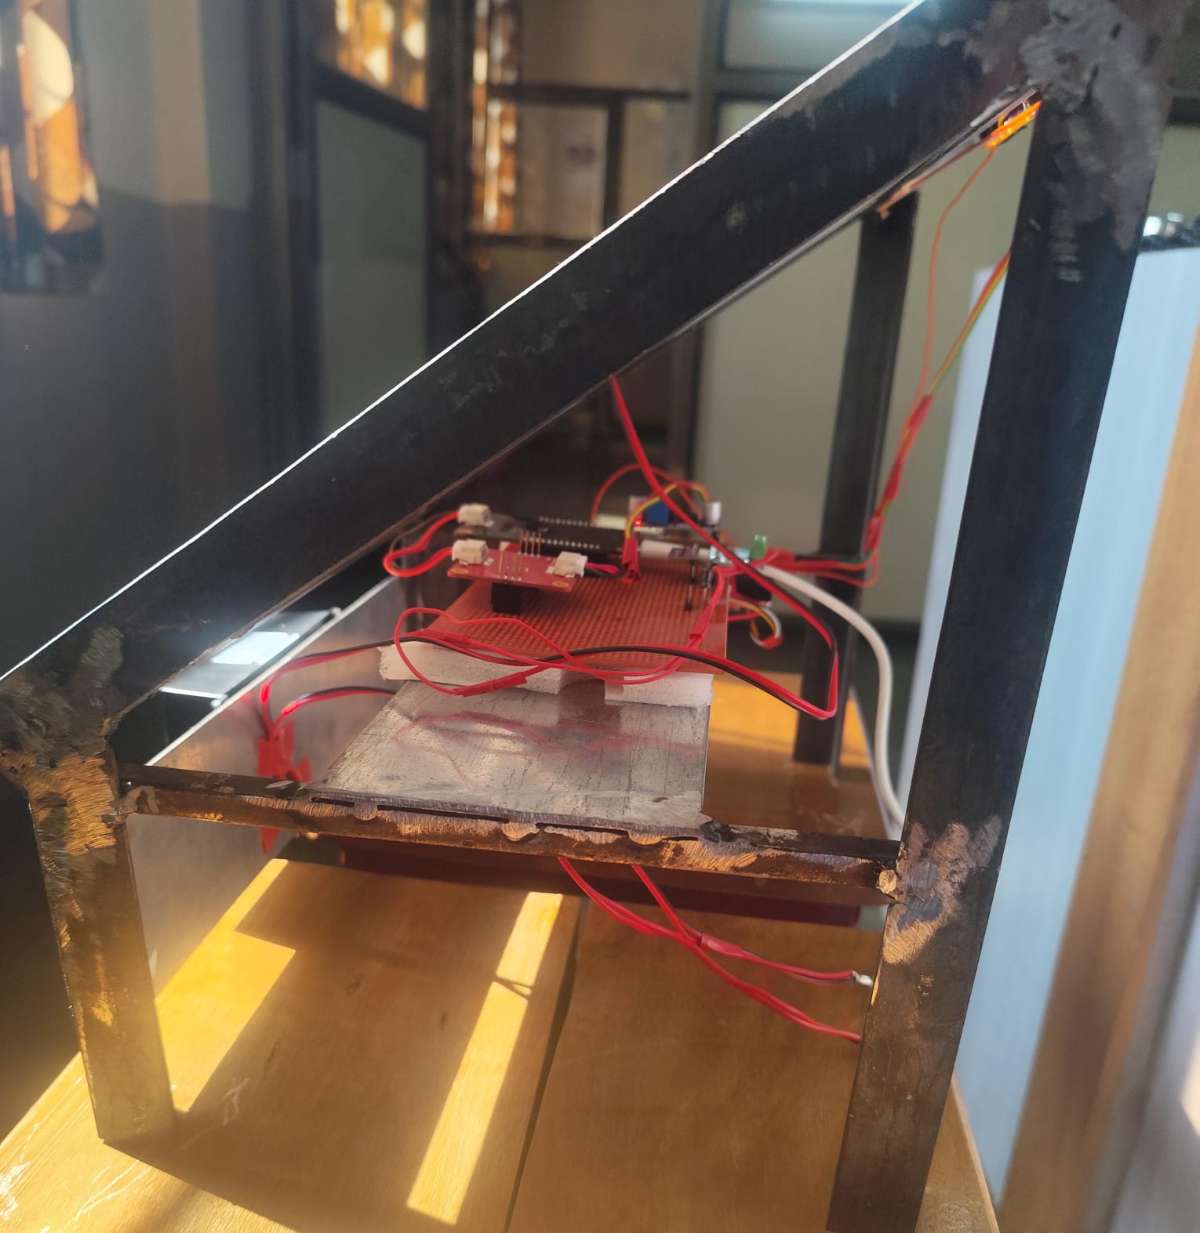
Step 3: Solar Power Subsystem Assembly
The solar panel was connected to the solar charge controller, which regulated charging and protected the energy storage system. A 12V rechargeable battery was connected to the controller to store generated energy and provide continuous power during low-light conditions.
Step 4: Integration with Monitoring System
The INA219 sensor was installed within the power path to monitor electrical parameters such as voltage and current. A DC-DC buck converter was used to derive a stable supply voltage for the ESP32 and associated sensors from the battery output.
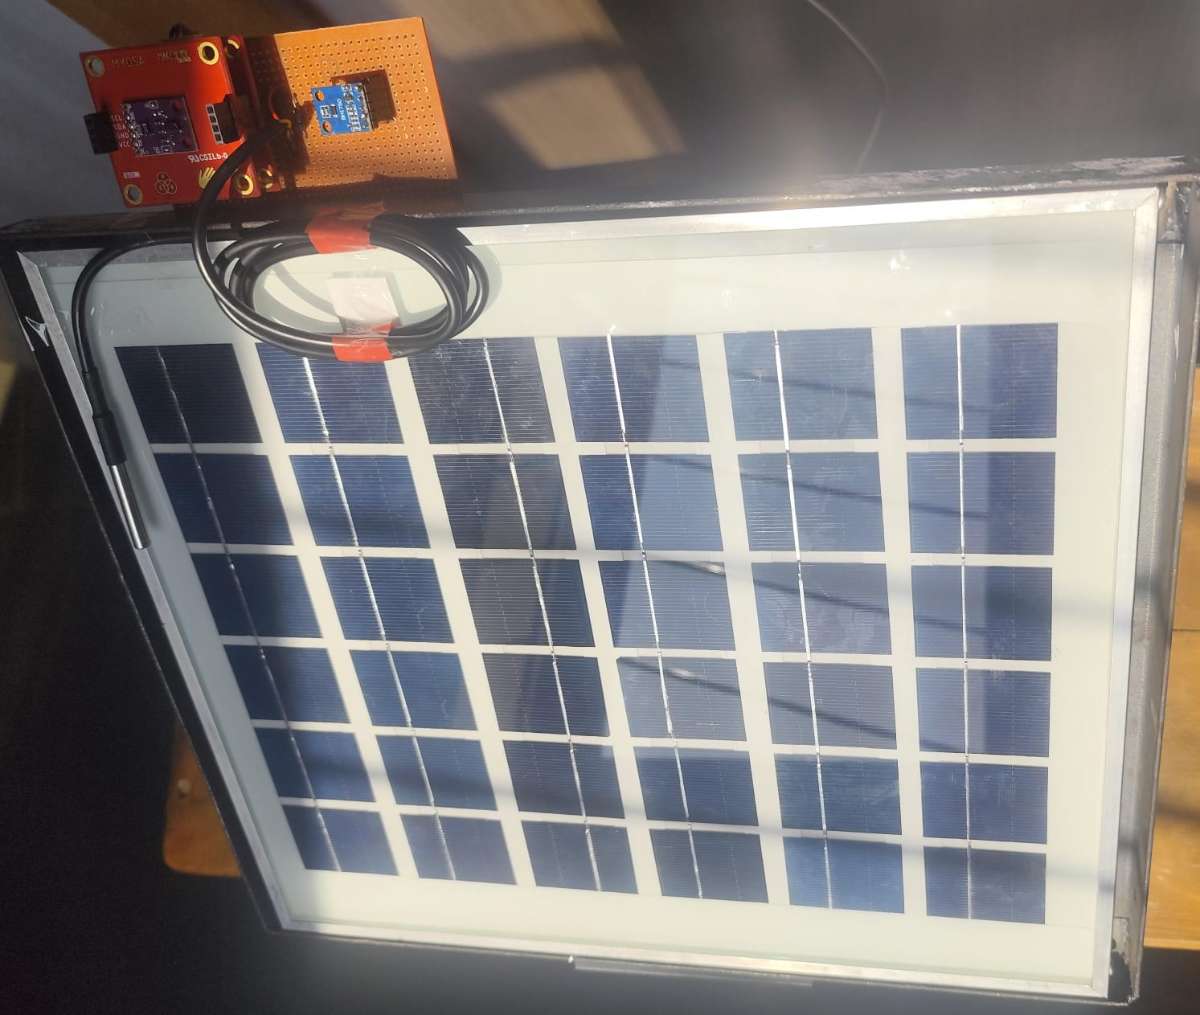
Step 5: Sensor Mounting on Solar Panel
The sensing modules were strategically mounted around the solar panel assembly:
- DS18B20 was attached to the rear surface of the panel to measure panel temperature.
- MPU6050 was fixed to the panel frame to monitor tilt angle and physical disturbances.
- PM2.5 sensor was positioned to sample surrounding air for dust analysis.
- BH1750 was mounted with unobstructed exposure to sunlight for accurate irradiance estimation.
- APDS9960 was placed to observe panel surface conditions and nearby obstructions.
Environmental sensors were installed within a protective enclosure while maintaining exposure to ambient air.
Step 6: Power-On and Functional Testing
The complete assembly was powered using the solar panel and battery system. Sensor readings, OLED display updates, Wi-Fi connectivity, and data transmission to the Flask AI server were verified under actual operating conditions.
AI Architecture
The machine learning model used in TejasArk was trained using a dataset comprising approximately 5,000 samples stored in CSV format. The dataset was designed to represent diverse environmental and operational conditions encountered by solar installations across different geographical terrains and climatic regions.
Features Used for Training :
- Solar panel voltage
- Solar panel current
- Ambient temperature
- Panel temperature
- Humidity
- Light intensity (Lux)
- Dust sensor values
- Tilt angle
- Vibration measurements
- Proximity readings
- RGB reflection data
1) Training Process :
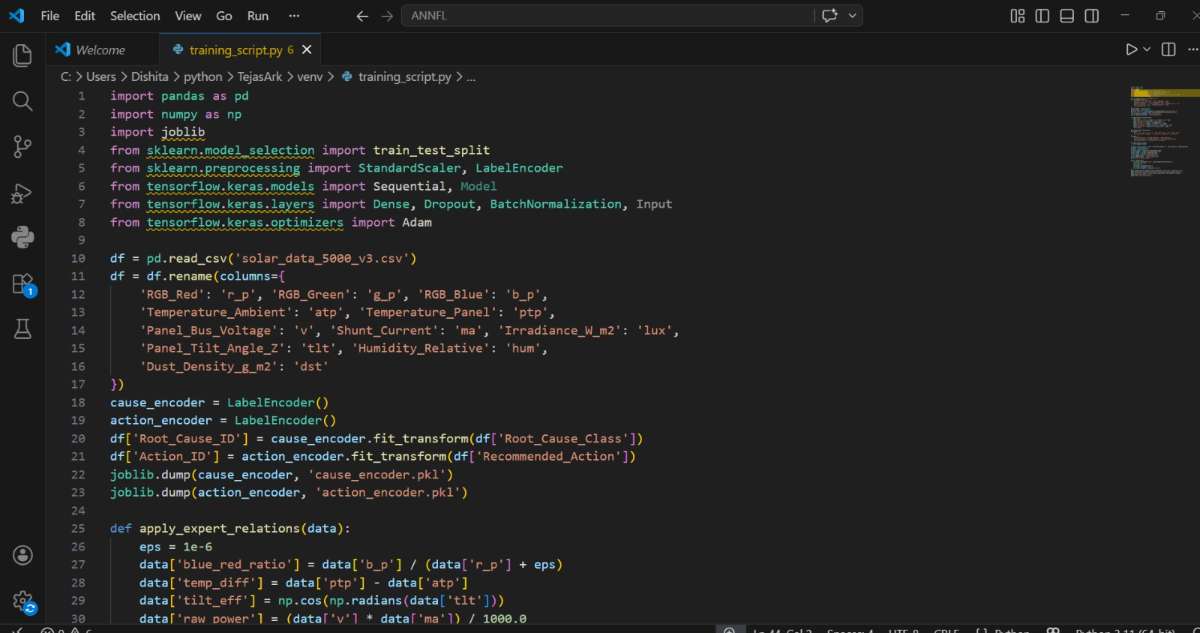
Stage 1: Data Loading
The collected dataset was imported into a Pandas DataFrame and validated for consistency.
Stage 2: Data Preprocessing
- Missing value handling
- Outlier filtering
- Feature normalization
- Data type validation
Stage 3: Feature Engineering
Additional performance indicators were generated from raw sensor readings, including:
- Estimated solar power
- Temperature differential
- Environmental condition indices
- Panel health indicators
Stage 4: Model Training
The dataset was divided into:
- 80% Training Data
- 20% Testing Data
The machine learning model was trained using approximately 5,000 historical observations to learn relationships between environmental conditions and solar system performance.
Stage 5: Model Evaluation
Performance was evaluated using standard metrics such as:
- Mean Absolute Error (MAE)
- Root Mean Square Error (RMSE)
- Accuracy and validation scores (where applicable)
The trained model was then exported and integrated into the Flask AI server for real-time inference.
2) Flask AI Server
The TejasArk intelligence engine is implemented as a Flask-based AI server consisting of three independent processing pipelines. Each pipeline performs a specific task and collectively provides real-time solar asset monitoring and diagnostics.
Pipeline 1: Data Acquisition and Validation
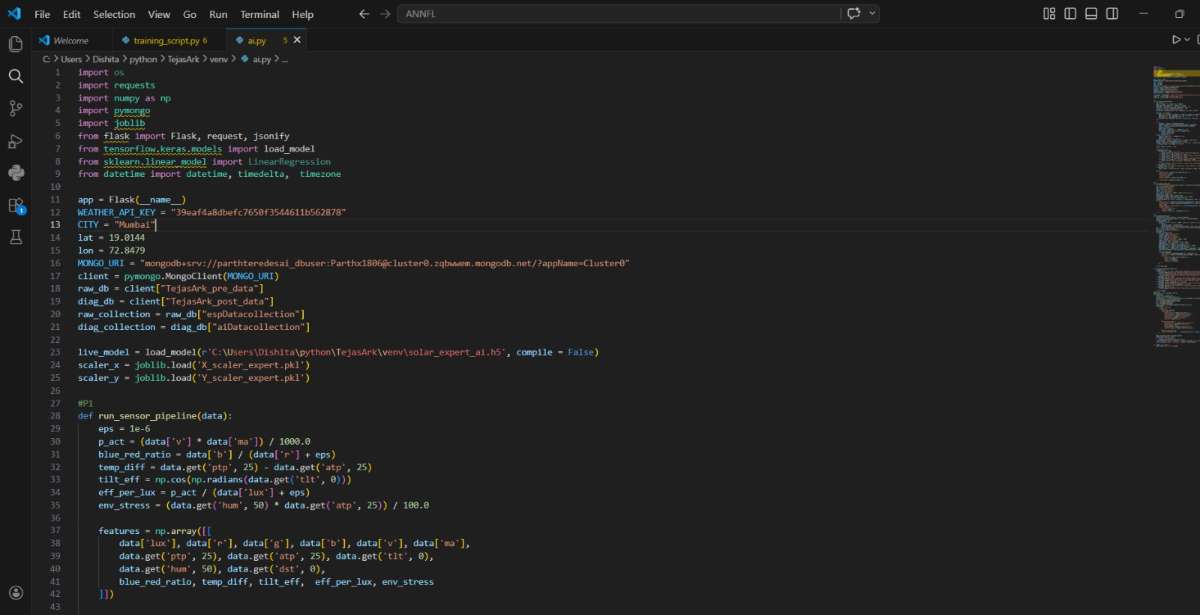
This pipeline receives sensor data transmitted by the ESP32 through HTTP requests.
Inputs :
- Solar voltage
- Solar current
- Panel temperature
- Ambient temperature
- Humidity
- Light intensity
- Dust concentration
- Tilt angle
- Vibration data
- Proximity and RGB sensor values
Functions :
- Data reception
- Missing value handling
- Range validation
- Data normalization
- Timestamp generation
Output :
A clean and structured dataset ready for AI processing.
Pipeline 2: Solar Generation Forecasting Engine
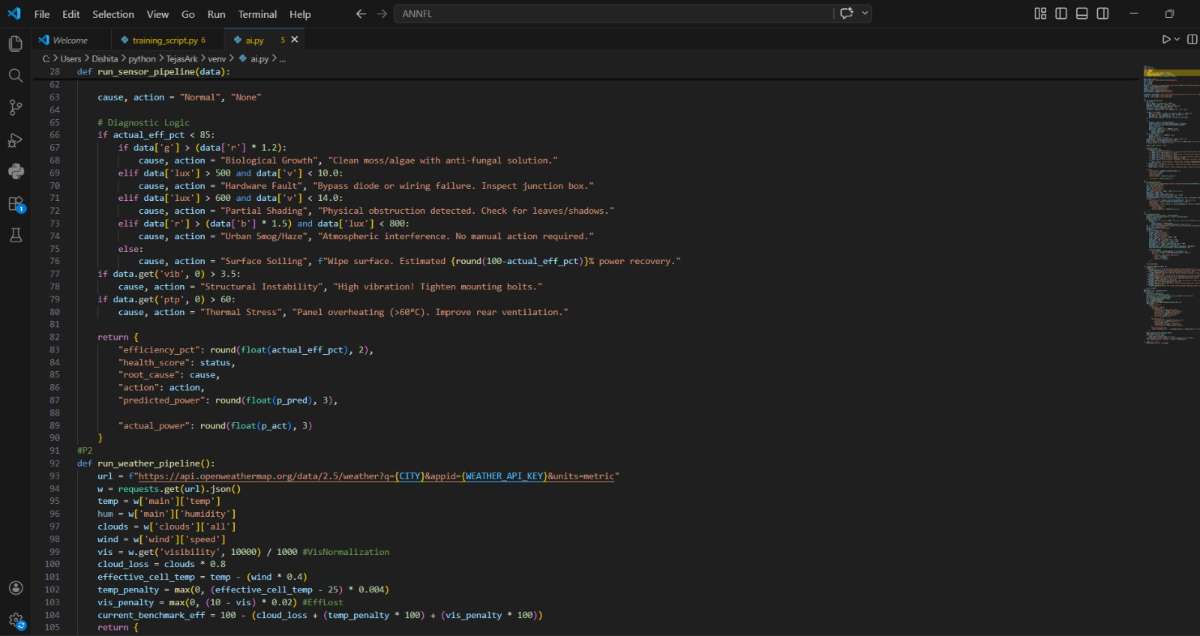
This pipeline predicts the expected solar energy generation for the current day by combining historical system performance with real-time weather information.
- Historical Panel Data
- Previous 5 days of sensor records
- Solar voltage and current trends
- Panel temperature history
- Light intensity patterns
- Environmental conditions
2. Weather API Data
- Current weather conditions
- Forecasted temperature
- Humidity
- Cloud cover
- Atmospheric conditions
- Solar irradiance-related parameters
3. Processing Steps
- Retrieve the previous 5 days of operational data from cloud storage.
- Fetch current-day weather information using a weather API.
- Combine historical performance data with forecasted environmental conditions.
- Generate feature vectors for the machine learning model.
- Execute the trained forecasting model.
- Estimate expected solar generation and system performance for the day.
4. Output
- Predicted daily solar power generation
- Expected system efficiency
- Weather impact assessment
- Performance trend indicators
- Generation forecast visualization
5. Purpose
By incorporating both historical operational behavior and current weather forecasts, the prediction engine can provide more accurate estimates of solar energy production than models relying solely on real-time sensor measurements.
Pipeline 3: Hybrid Forecasting and Decision Intelligence Engine
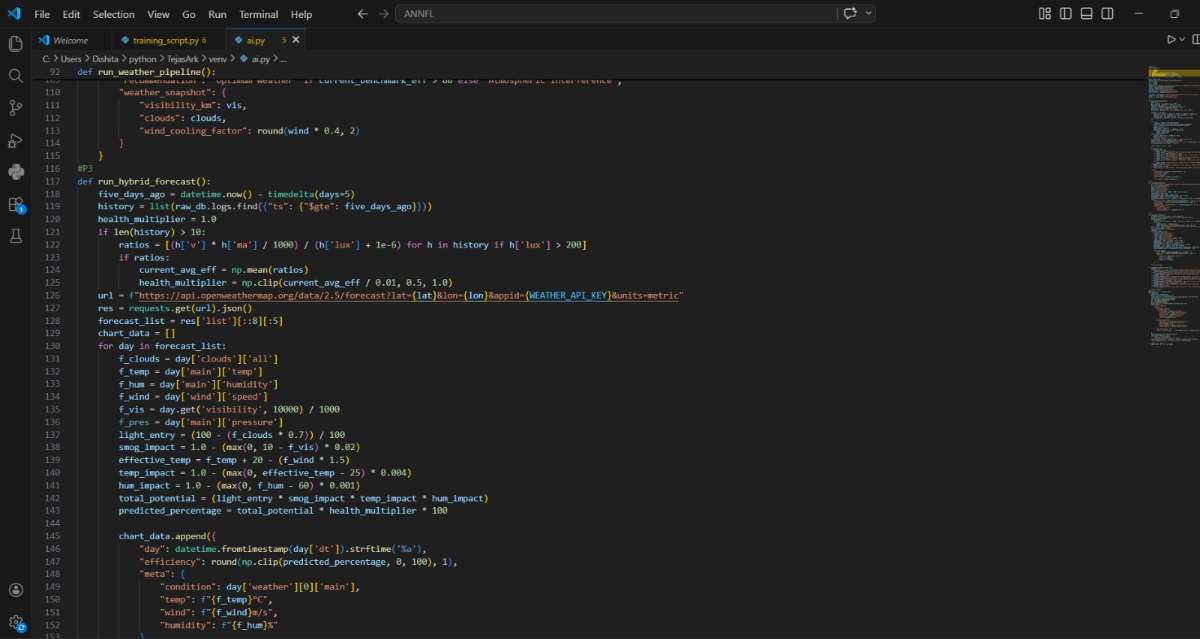
This pipeline generates future solar generation forecasts by combining weather predictions with historical solar performance patterns.
1. Processing Steps
- Retrieve historical solar system performance data.
- Collect 5-day weather forecast information from the Weather API.
- Combine historical operational trends with forecasted weather conditions.
- Generate hybrid feature vectors for prediction.
- Execute the machine learning forecasting model.
- Estimate future solar generation for upcoming days.
- Assess expected efficiency and environmental impacts.
2. Outputs
- Multi-day solar generation forecast
- Expected power production trends
- Weather impact analysis
- Predicted system efficiency
- Future performance visualization
- Operational planning insights
3. Purpose
The hybrid forecasting engine enables TejasArk to move beyond real-time monitoring by providing predictive intelligence. By combining historical system behavior with future weather conditions, the platform can estimate solar energy generation for upcoming days and assist users in energy planning and resource management.
Dashboard and Visualization Platform
The TejasArk dashboard serves as the central user interface for monitoring, analysis, and forecasting. Developed using Python Flask and modern web technologies, it transforms raw sensor data into meaningful visual insights.
The dashboard is connected to the cloud database and AI server, enabling:
- Real-time synchronization.
- Remote monitoring.
- Historical data retrieval.
Continuous model-assisted analysis.
Key Benefits
- Centralized solar asset monitoring.
- AI-powered decision support.
- Real-time and predictive analytics.
- Remote accessibility.
- Enhanced maintenance planning.
- Improved solar energy utilization.
Source Code Repository
The complete source code, documentation, and implementation details of the TejasArk AI Solar Intelligence Platform are available on GitHub.
GitHub Repository: https://github.com/parthteredesai/TejasArk_portal
Project Demonstration
A working demonstration of the TejasArk AI Solar Intelligence Platform can be viewed at:
Project Video: https://www.youtube.com/watch?v=tCsTsO6hSgI