
How We Built It — Step by Step
Step 1 — Define the Problem and Plan the Architecture
We started by mapping out the 5 core problems: no real-time data, late warnings, no ward-specific alerts, dangerous manual inspection, and zero data-driven prediction. From there we designed a 3-layer architecture:
[ESP32 Sensor Nodes] → HTTP POST every 5s → [Flask + ML Backend] → [React Dashboard]
Water Level + Rain ↓
[SMS / WhatsApp / Telegram Alerts]
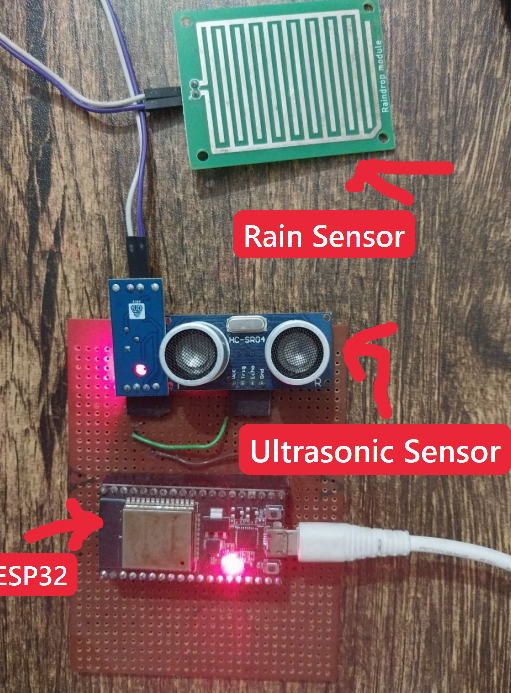
Step 2 — Build the Sensor Hardware
Each sensor node uses:
- ESP32 DevKit v1 — WiFi-enabled microcontroller
- HC-SR04 Ultrasonic Sensor — measures water depth in the drain with ±3 mm accuracy
- FC-37 Rain Sensor — detects rainfall, digital output
- Voltage divider (1kΩ + 2kΩ resistors) — steps down the 5V ECHO signal to 3.3V safe for ESP32
- 5V supply
- Zero PCB
How water level measurement works:
The sensor is mounted 50 cm above the drain floor. It fires a 40 kHz ultrasonic pulse, measures how long the echo takes to return, and calculates the distance to the water surface. Water level = 50 cm − measured distance.
Echo duration = 1765 µs
Distance = 1765 × 0.034 / 2 = 30 cm
Water level = 50 − 30 = 20 cm
Takes 5 samples, discards outliers, averages the rest — eliminates noise
Classifies last 5 readings as RISING / FALLING / STABLE
Buffers 50 readings in RAM when WiFi drops, auto-flushes on reconnect — zero data loss during storms
Sends a heartbeat ping every 30 seconds so the server knows the sensor is alive
LED indicator: Green (normal) → Yellow (elevated) → Red (critical) → Blinking (offline)
On boot, calls /iot/register to look up its ID from the database automatically
Alert thresholds:
Water Level Status Action
0–14 cm NORMAL No alert
15–24 cm WATCH Monitor
25–34 cm ELEVATED MEDIUM alert sent
35–44 cm DANGER HIGH alert sent
45–50 cm CRITICAL HIGH alert — overflow imminent
Technologies Used:
| Hardware | ESP32 DevKit v1, (HC-SR04) Ultrasonic Sensor, (FC-37) Rain Sensor |
| Backend | Python 3, Flask 3.1, SQLite, XGBoost, scikit-learn, TensorFlow/Keras, PyJWT, bcrypt |
| Frontend | React 18, Vite, Leaflet.js, GeoJSON |
| Alerts | Twilio (SMS), Meta Cloud API (WhatsApp), Telegram Bot API |
| Testing | Hypothesis, fast-check |
| APIs | WeatherMap |
Step 3 — Build the Backend (Flask + ML + Database)
The Python Flask backend is the brain of the system. It receives data from sensors, stores it, runs it through ML models, and dispatches alerts.
Database: SQLite with WAL mode — tables for sensors, wards, IoT readings, alerts, and users.
The ML pipeline:
We trained an XGBoost classifier on 58 labeled samples. Why XGBoost and not a neural network? Because 58 samples would cause severe overfitting in a deep learning model. XGBoost's regularization handles small datasets perfectly and trains in milliseconds.
Four features go in:
- Rain present (0 or 1)
- Water level (cm)
- Elevation proxy (ward elevation category)
- Drainage capacity proxy (drain condition score)
- One label comes out: CRITICAL / HIGH / MEDIUM / LOW flood risk
Flood Safety Score formula (0–100 per ward):
We invented a weighted scoring formula that aggregates all sensors in a ward into one number. Each ward gets a color on the map: Green (safe) → Yellow (moderate) → Orange (high risk) → Red (critical).
Anomaly detection:
We used Z-score analysis and Isolation Forest to flag abnormal water rise rates — catching dangerous spikes before they cross alert thresholds.
Multi-step forecasting:
scikit-learn regression models predict water levels 5, 10, 15, 20, 25, and 30 minutes into the future. We also trained an LSTM (TensorFlow/Keras) for time-series prediction.
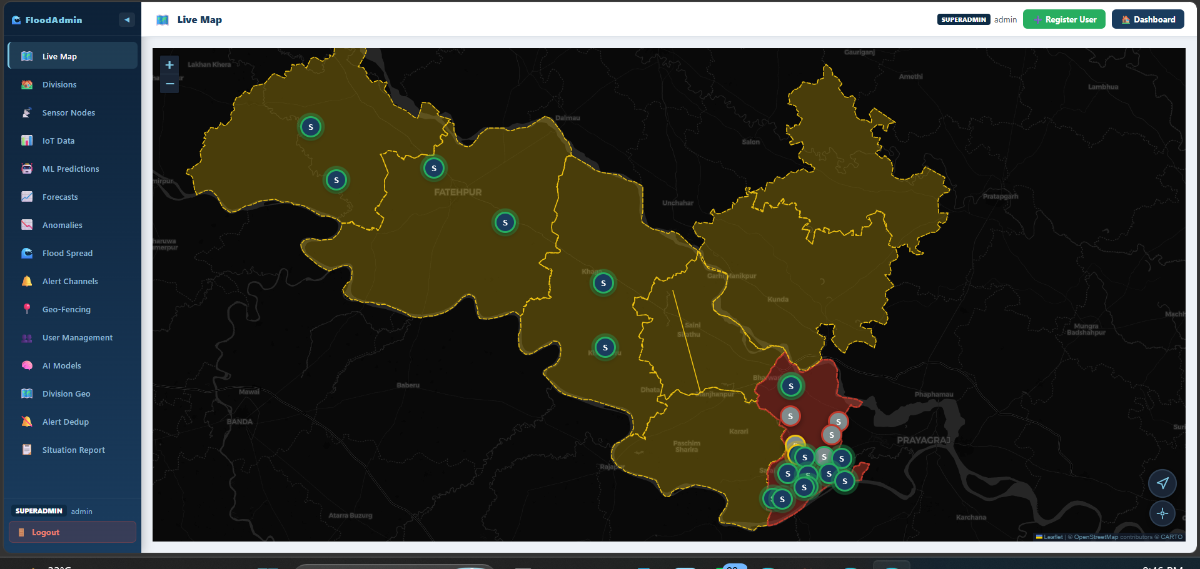
Step 4 — Build the Frontend
We built a React 18 + Vite single-page application. The map is built with Leaflet.js + GeoJSON, using Prayagraj's ward boundary polygons stored as a GeoJSON file.
Real-time updates without page refresh:
We used Server-Sent Events (SSE) — a persistent HTTP connection from the browser to the server. The moment a sensor sends a reading, it appears on every dashboard within seconds. No polling, no page refresh.
Dashboard features:
- Live color-coded map of all city wards, updated every 5 seconds
- Sensor markers with animated water level popups (pulse animation for active sensors)
- Flood prediction panel showing ML probability scores per sensor
- Anomaly panel showing rapid rise rate alerts
- Evacuation route layer — safe exit paths overlaid on the map
- Auto-generated situation report (plain-text briefing for emergency managers)
Admin panel features:
Full CRUD interface for sensors, wards, users, and alert channels
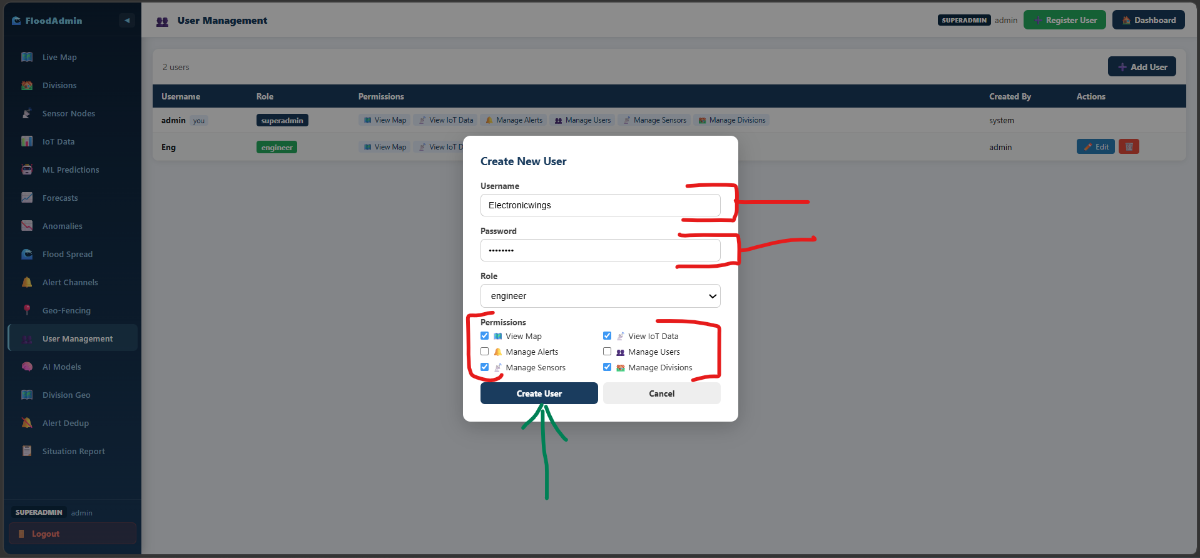
4.1. Admin Pannel
- Click User Management
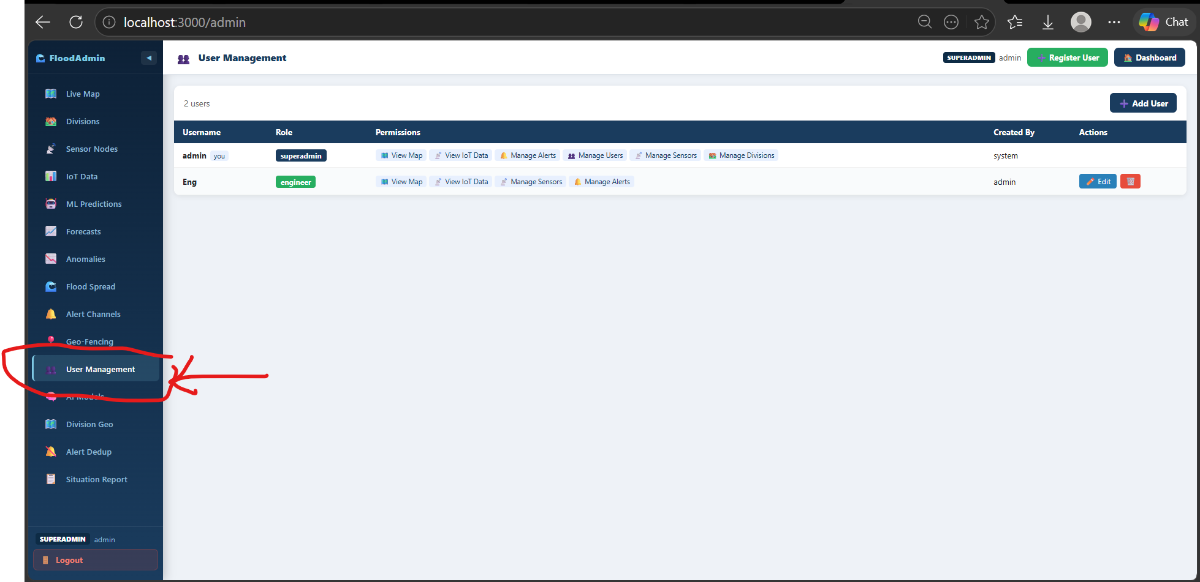
2. Click Add User
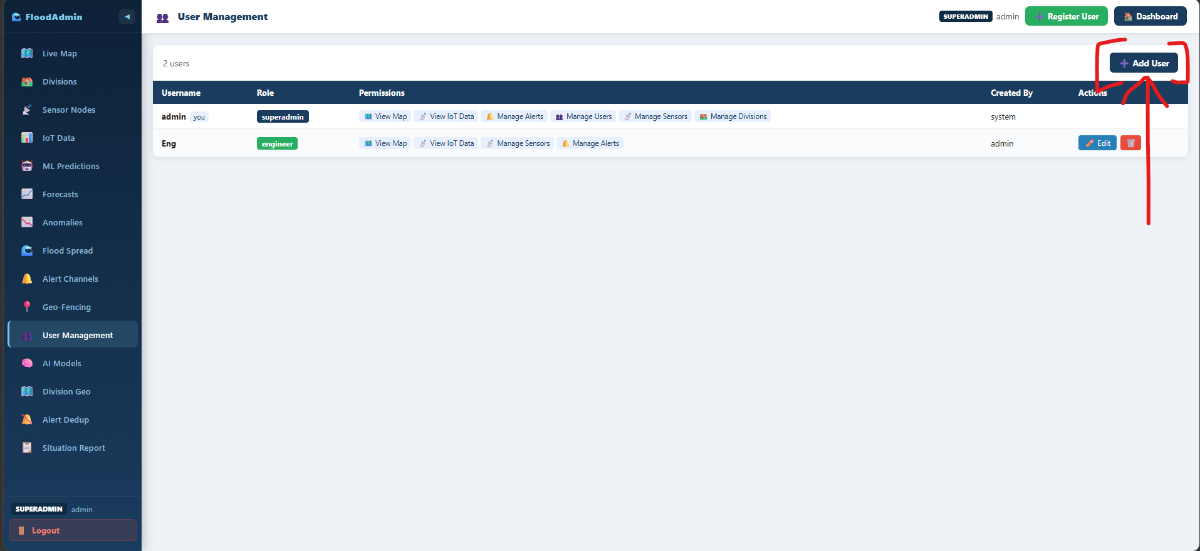
3. Fill the details and Select Permissions
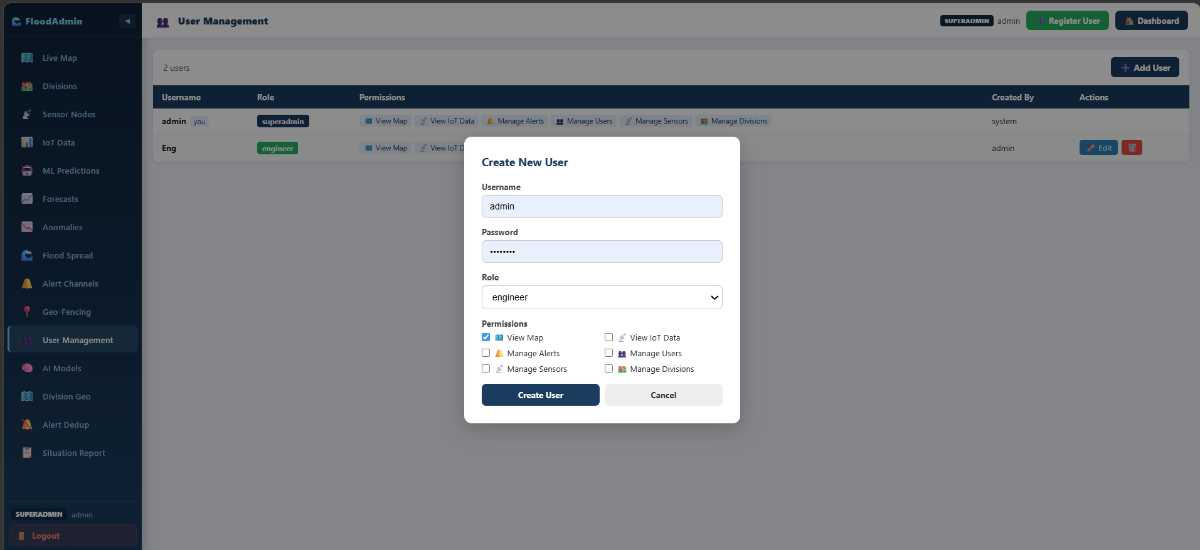
Role-based access control: Superadmin → Admin → Engineer (3 roles with granular permissio)
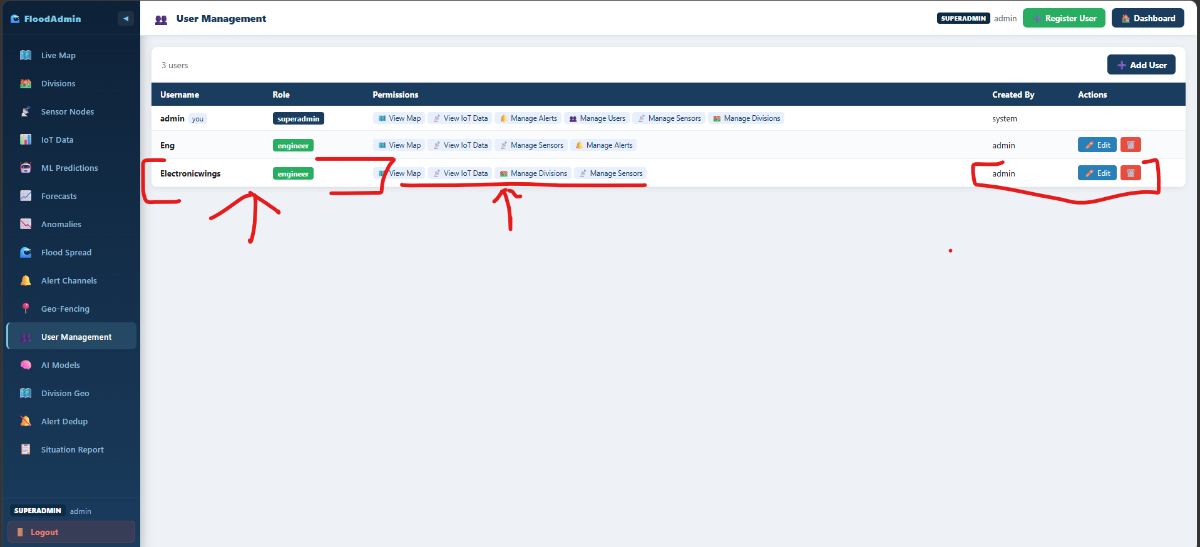
4. Click Create User
5. Check the new add User
Sensor Nodes : Add/Remove (Admin Pannel)
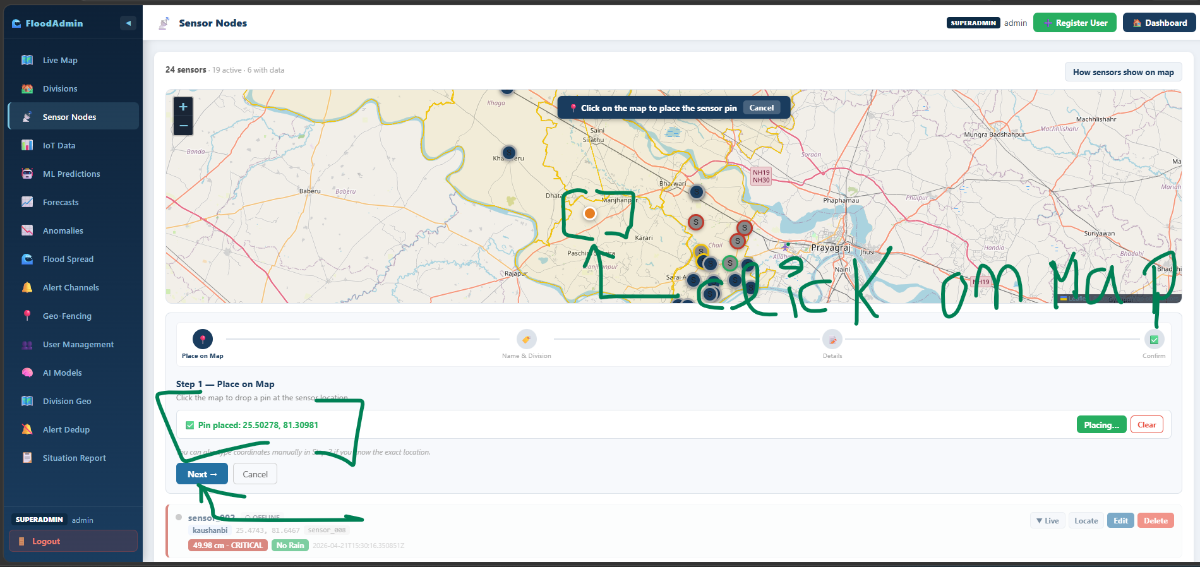
1. Click Sensor Node
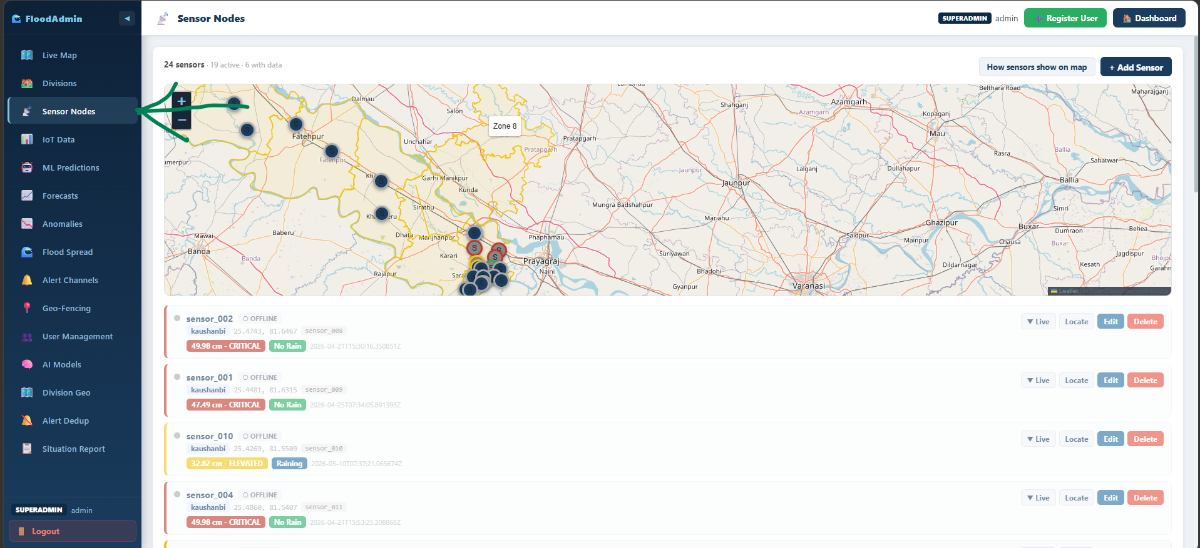
2. Click Add Sensor
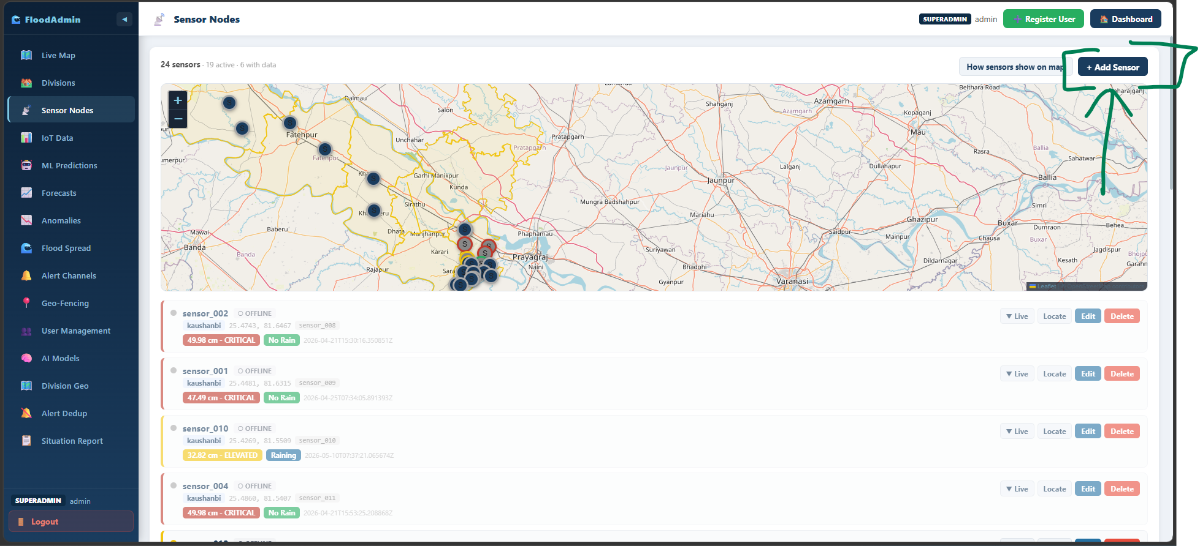
3. Click on the map there you fixed The IoT Device
- Automatically catch the GPS location.
- Click Next
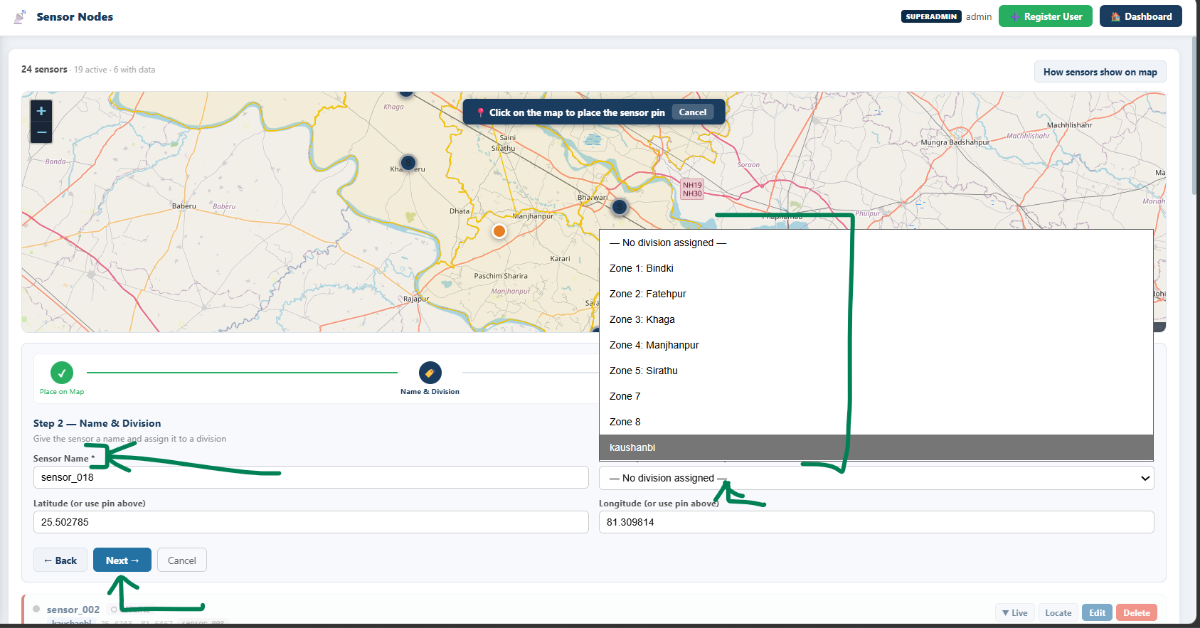
4. Fill the Details
- Add Sensor Name (Same name use in that esp node code use )
- Select The division
- Click Next
5. Add Description
- Click Next
.png)
6. Click Save Sensor 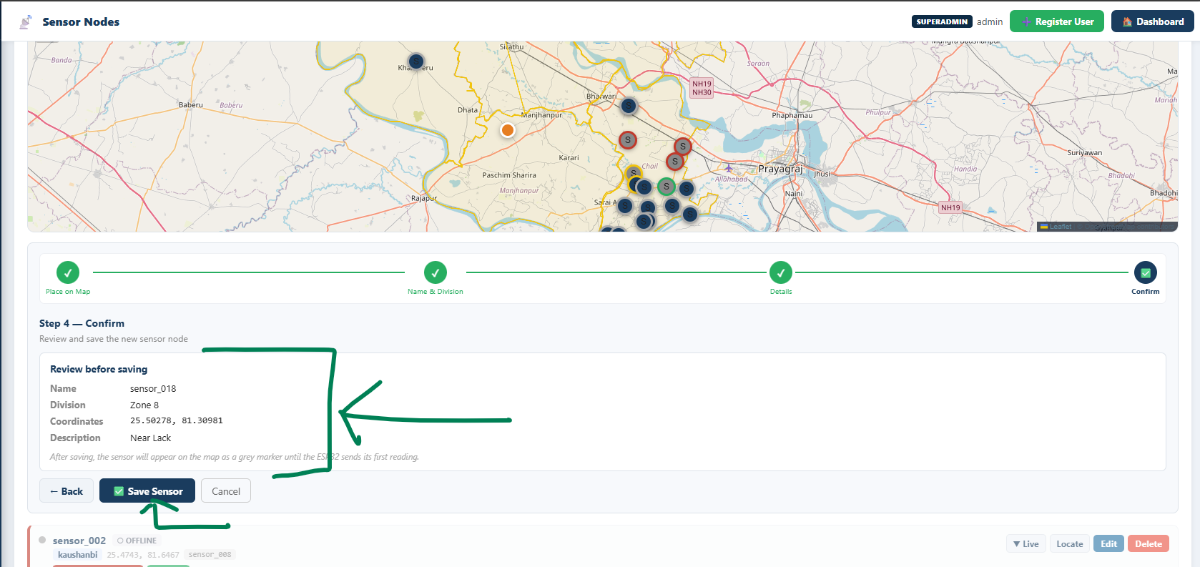
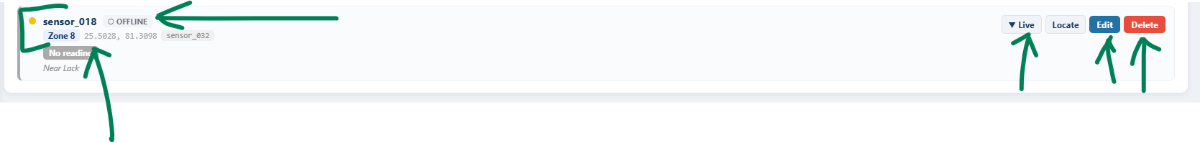
7. Check the Add New Sensor (we can edit/Delete)
- We can check (Online/Offline)
Alert Channel
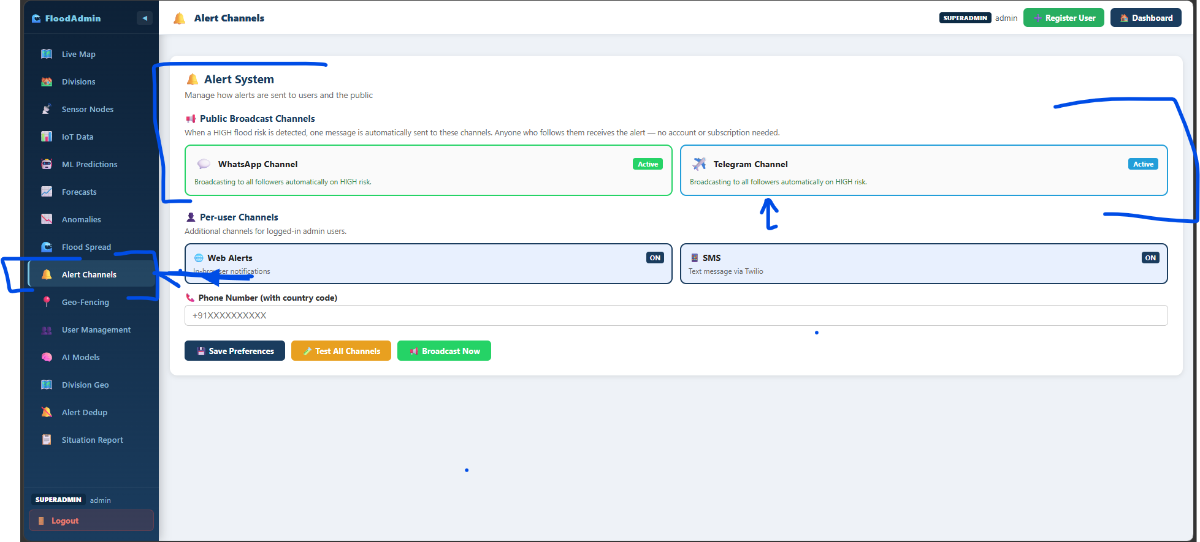
Alert engine:
When thresholds are crossed, the system automatically dispatches to:
- SMS via Twilio
- WhatsApp via Meta Cloud API
- Telegram via Telegram Bot API
An alert deduplication system prevents spam — a configurable cooldown window blocks repeat alerts for the same sensor within a set time.
Telegram Channel: https://t.me/prayagrajfloodalarts (The channel we recive notification)
.png)
Telegram recive all alert on channel.
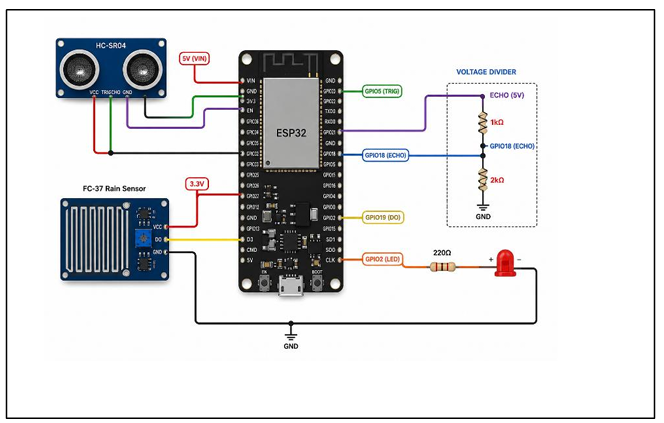
Step 6 — Circuit Connections
Hardware Prepare:
Pin Connection: ESP32 to HC-SR04
| ESP32 | HC-SR04: |
| 5V (VIN) | VCC |
| GND ( Common ground) | GND |
| GPIO 5 | TRIG ( Trigger pulse) |
| GPIO 18 | ECHO |
Voltage divider for ECHO pin:
ECHO (5V) ──[1kΩ]──┬──[2kΩ]── GND
│
GPIO 18 (3.3V safe)
ESP32 to FC-37 Rain Sensor:
| ESP32 Pin | FC-37 |
| 3.3V | VCC |
| GND | GND |
| GPIO 19 | DO (Digital Out) |
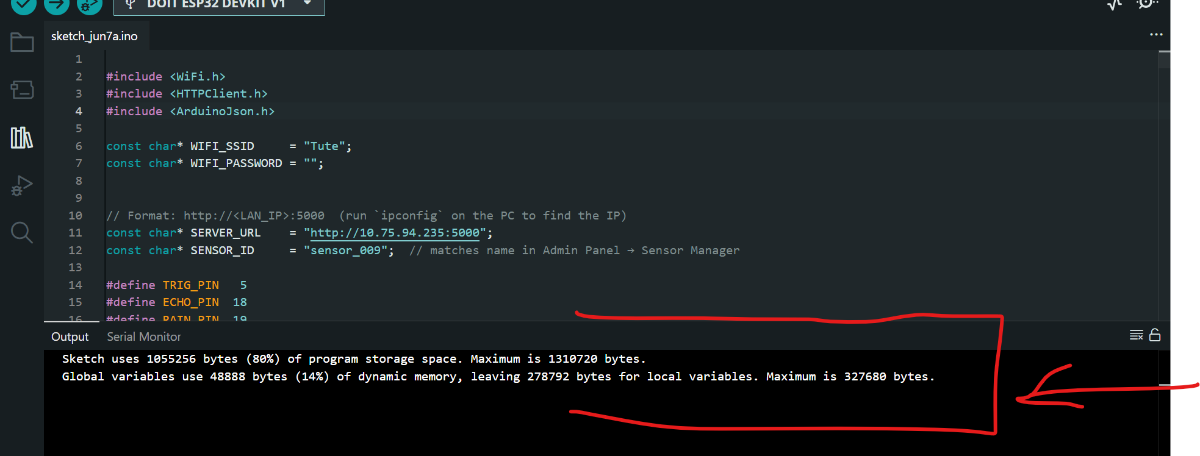
Hardware Coding Section:
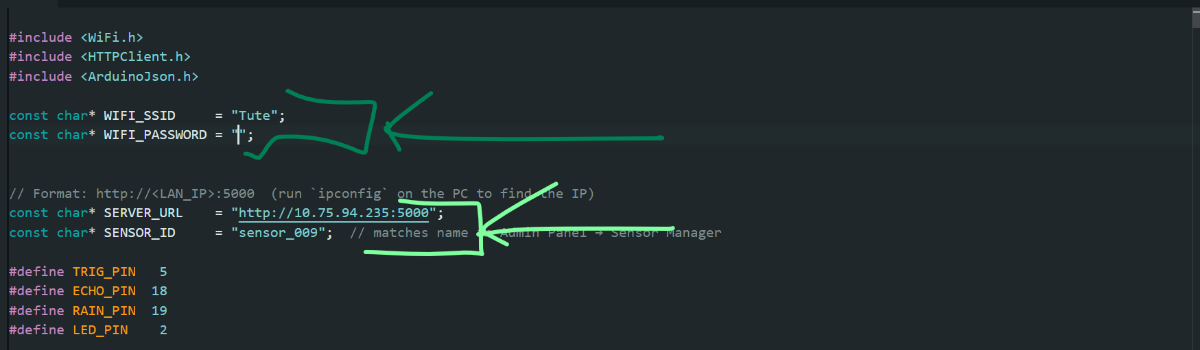
1. Open Arduino Ide: Open Code File
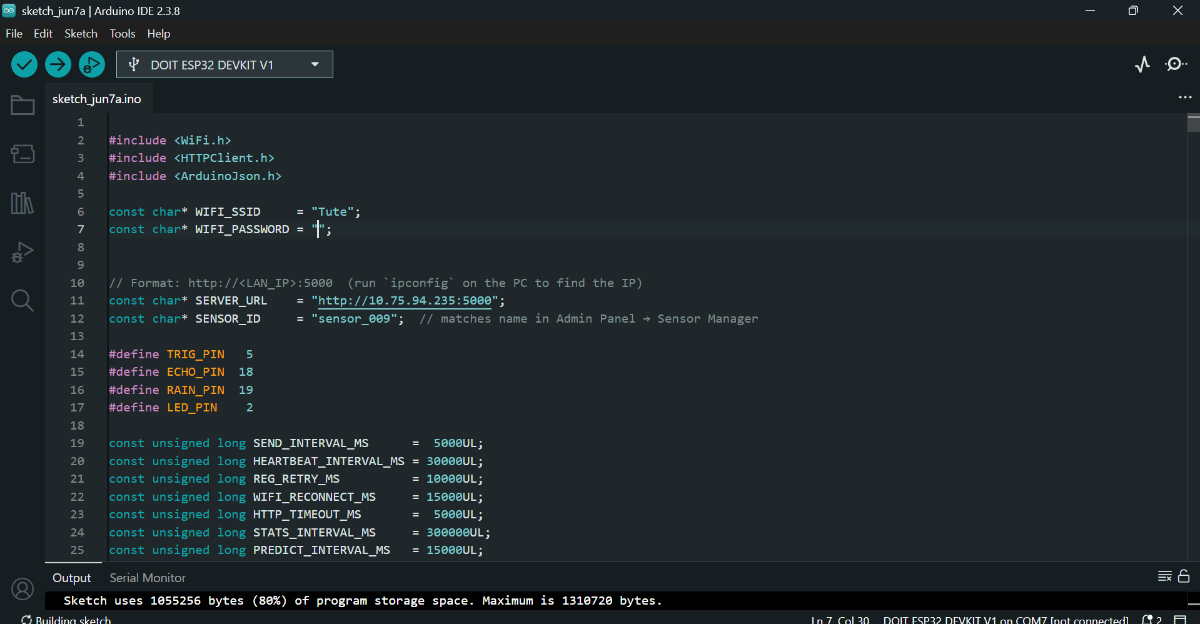
2. Change the Wifi, password, pc IP address and Sensor Id(Every time)
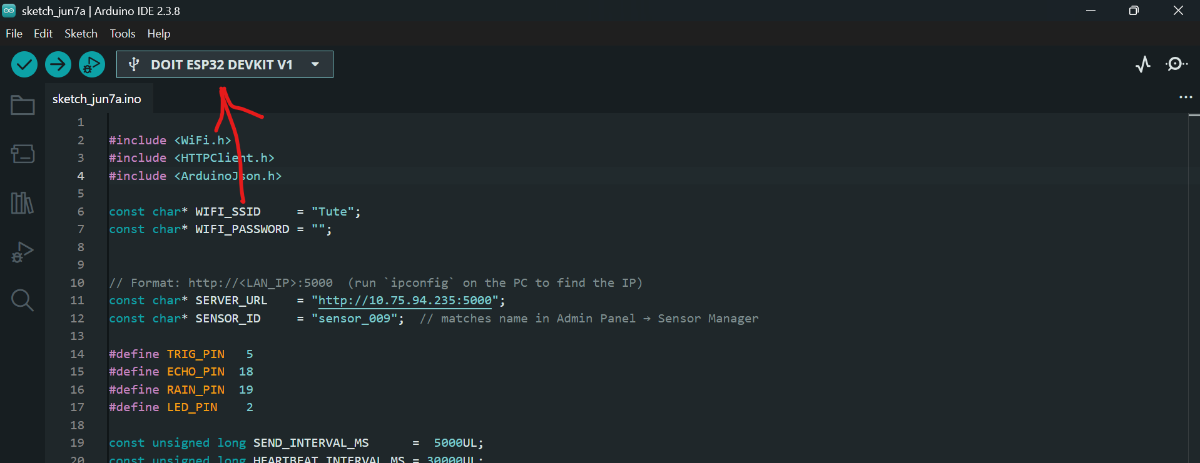
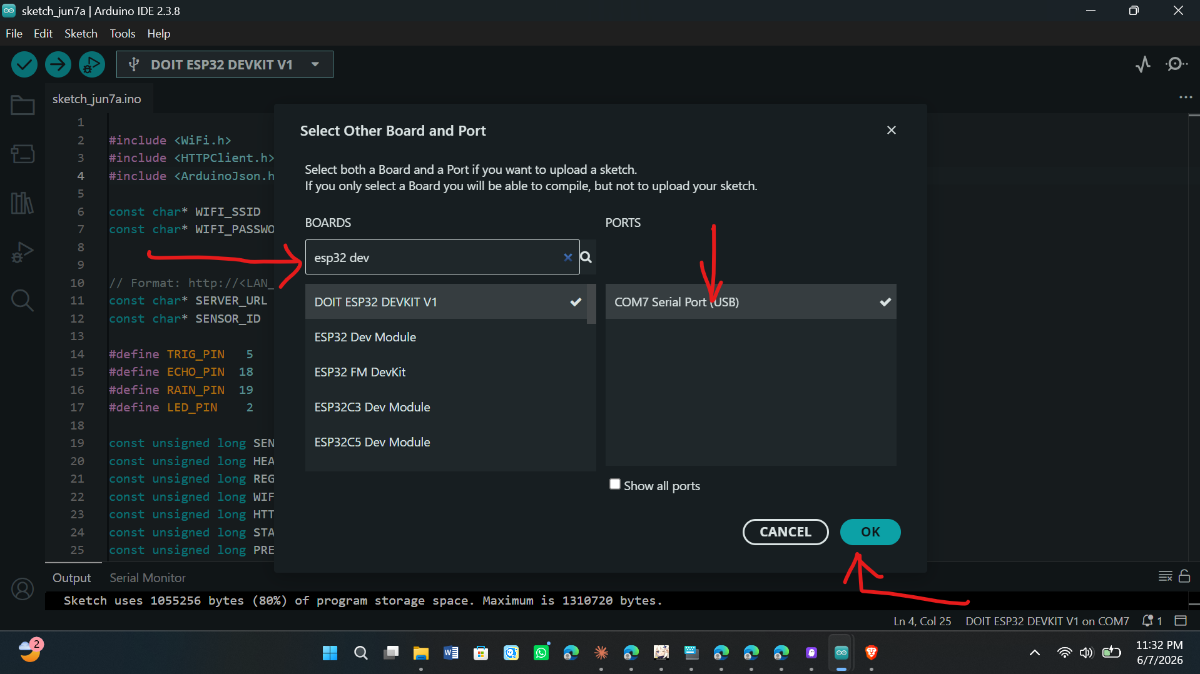
3. Select the Board
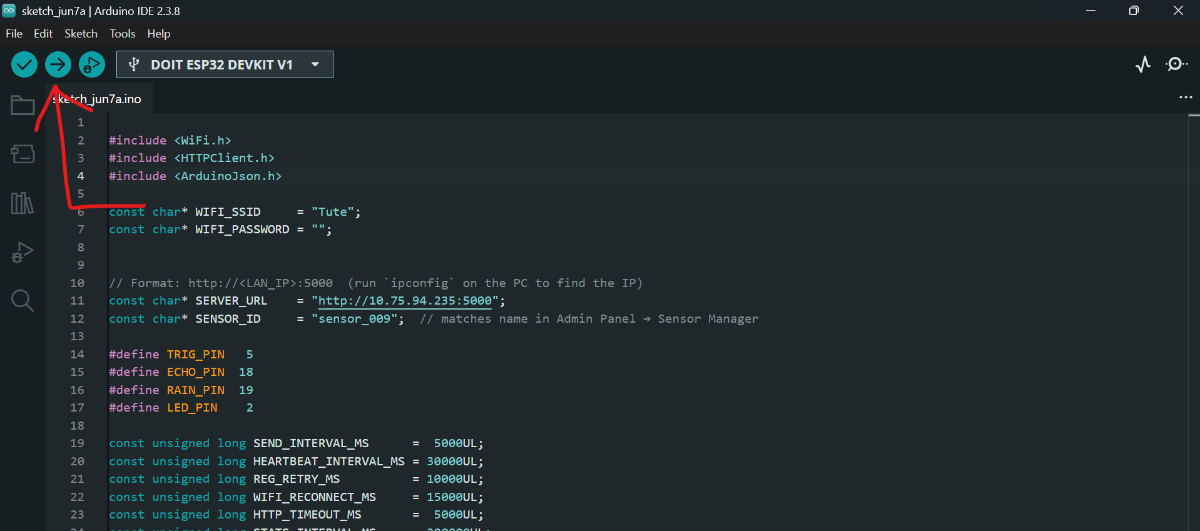
4. Upload
Open Serial Monitor
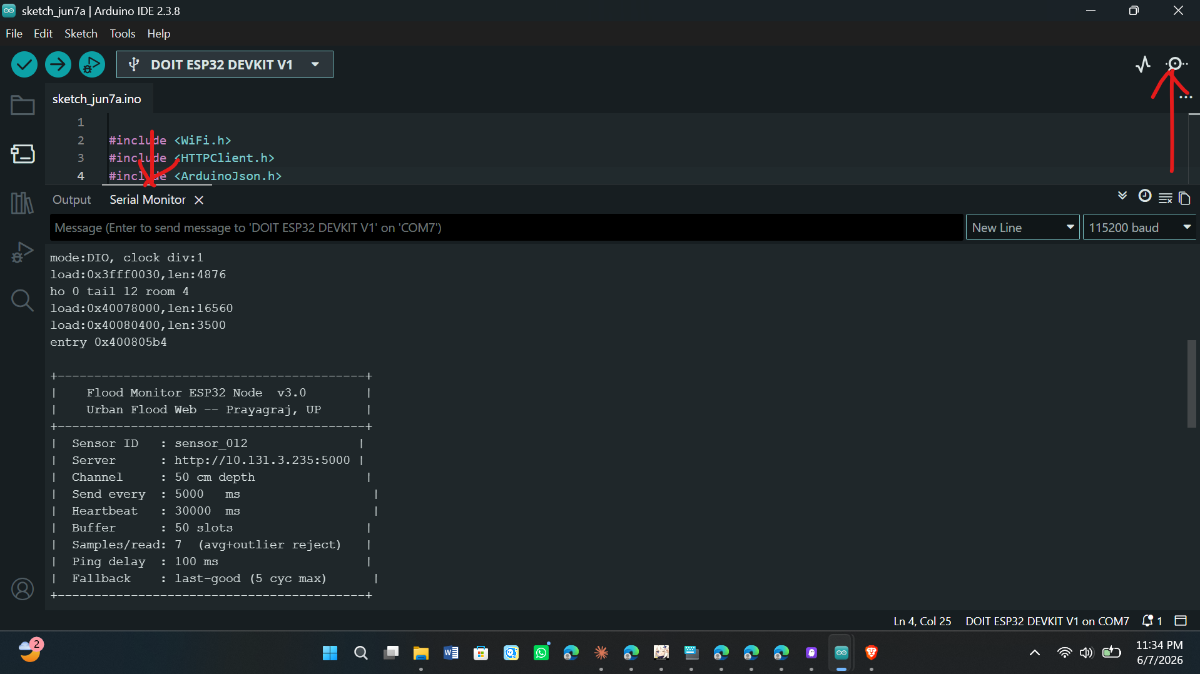
Ready To Use