
.jpg)

Introduction:
SpiroX is a smart digital spirometer developed to assess lung function by measuring air pressure generated during breathing. The system uses an MPS20N0040D pressure sensor with an HX710B ADC module to capture breathing pressure accurately. This provides an affordable and portable solution for respiratory monitoring.
The measured pressure data is processed by a WeMos ESP8266 microcontroller. Real-time results are displayed on an OLED screen, while a 10-level LED bar visually indicates breathing strength from weak to strong. This allows users to instantly understand their lung performance during testing.
SpiroX helps in monitoring respiratory conditions such as asthma and reduced lung capacity. It can be used in healthcare, home monitoring, medical education, and clinical assessment. The device is compact, low-cost, and easy to operate compared to traditional spirometers.
In addition to hardware monitoring, SpiroX includes a web dashboard that stores the history of previous lung tests for long-term analysis. Jury can access the dashboard using the provided website link and demo login credentials to review stored records and performance tracking.
Objective:
The main objective of SPIROX is to:
- Measure breathing strength
- Assess lung function
- Provide instant feedback
- Maintain historical records for analysis
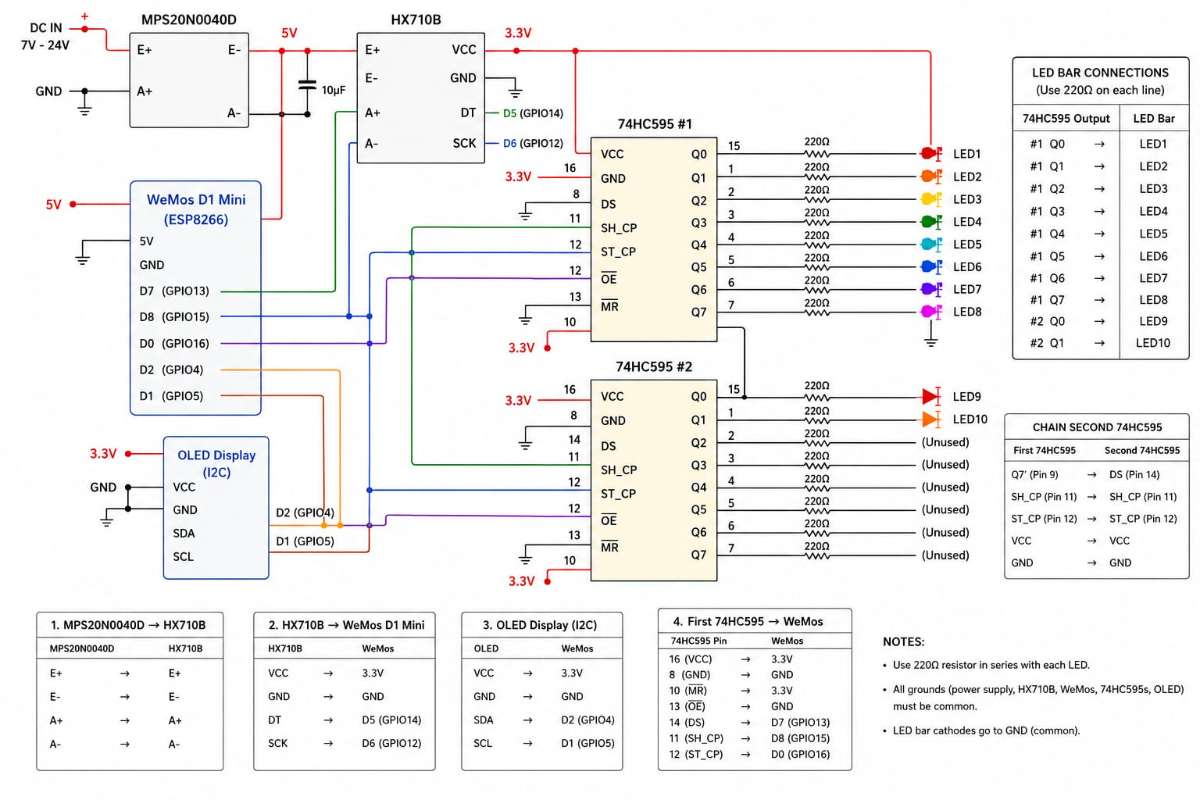
Working Principle:
The system works based on air pressure sensing.
Step 1: Connect Pressure Sensor (MPS20N0040D) to HX710B
The MPS20N0040D pressure sensor detects the air pressure when a patient blows into the tube. Since its output signal is very small, it must be amplified and converted into digital data using the HX710B.
Step 2: Connect HX710B to WeMos D1 Mini
The HX710B sends digital pressure values to the ESP8266 (WeMos D1 Mini).
Step 3: Connect OLED Display
The OLED is used to display airflow, lung capacity, and status messages.
Step 4: Connect First 74HC595 Shift Register
The first shift register controls LEDs 1–8 of the LED bar graph.This shift register receives data from the ESP8266.
Step 5: Connect Second 74HC595 (Daisy Chain)
The second shift register controls LEDs 9–10.
Step 6: Connect LED Bar Graph
Use a 220Ω resistor in series with every LED.
First 74HC595
O/P LED
Q0 LED1
Q1 LED2
Q2 LED3
Q3 LED4
Q4 LED5
Q5 LED6
Q6 LED7
Q7 LED8
Second 74HC595
O/P LED
Q0 LED9
Q1 LED10
and other side of LED bar 10 pin must be in Ground.
.png)
.png)
Step 8: Upload Program
- Connect WeMos D1 Mini to computer.
- Open Arduino IDE.
- Select this:
Board: LOLIN (WeMos) D1 R2 & Mini
Port: Correct COM Port - Upload your SpiroX code.
Step 9: Testing
- Power ON the device.
- Blow into the air tube.
- Pressure sensor detects airflow.
- HX710B converts pressure data.
- ESP8266 calculates airflow/lung function.
- LED bar lights according to airflow strength.
- OLED displays measured value.
- Data can be sent to your SpiroX web dashboard through microcable
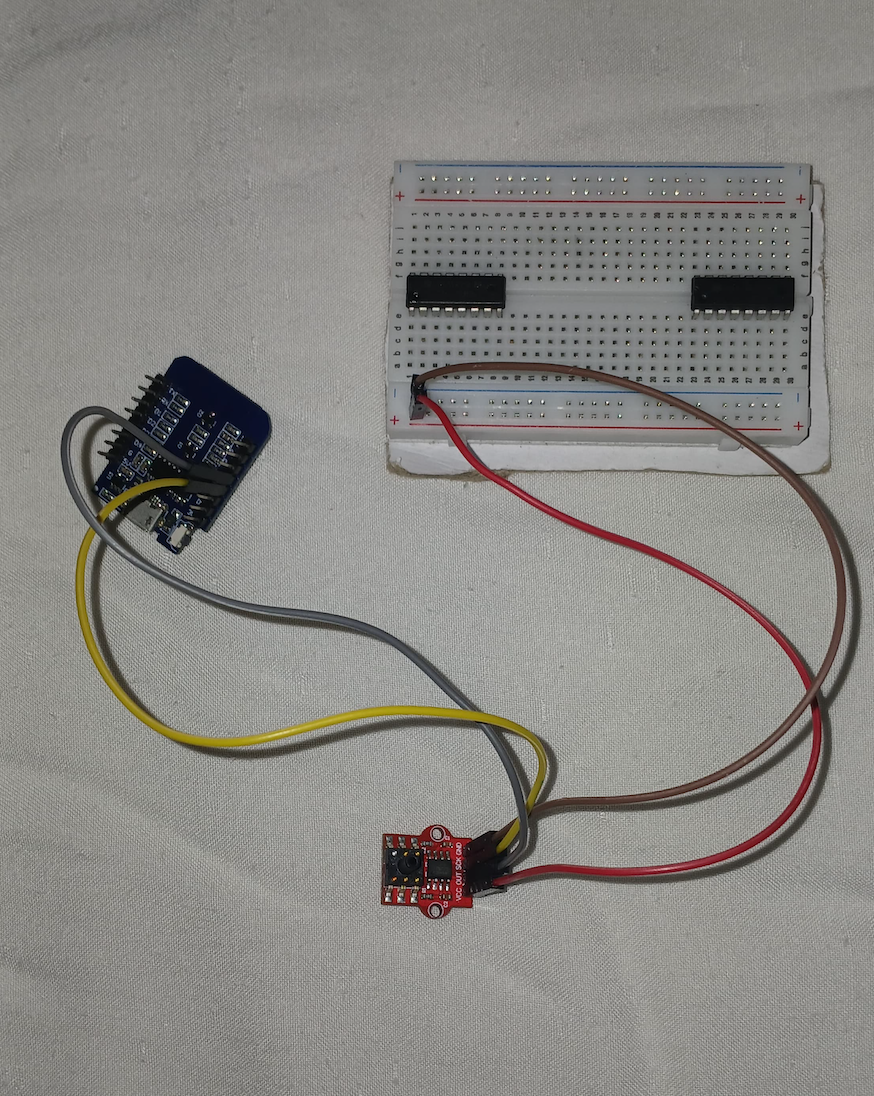
Circuit Diagram:
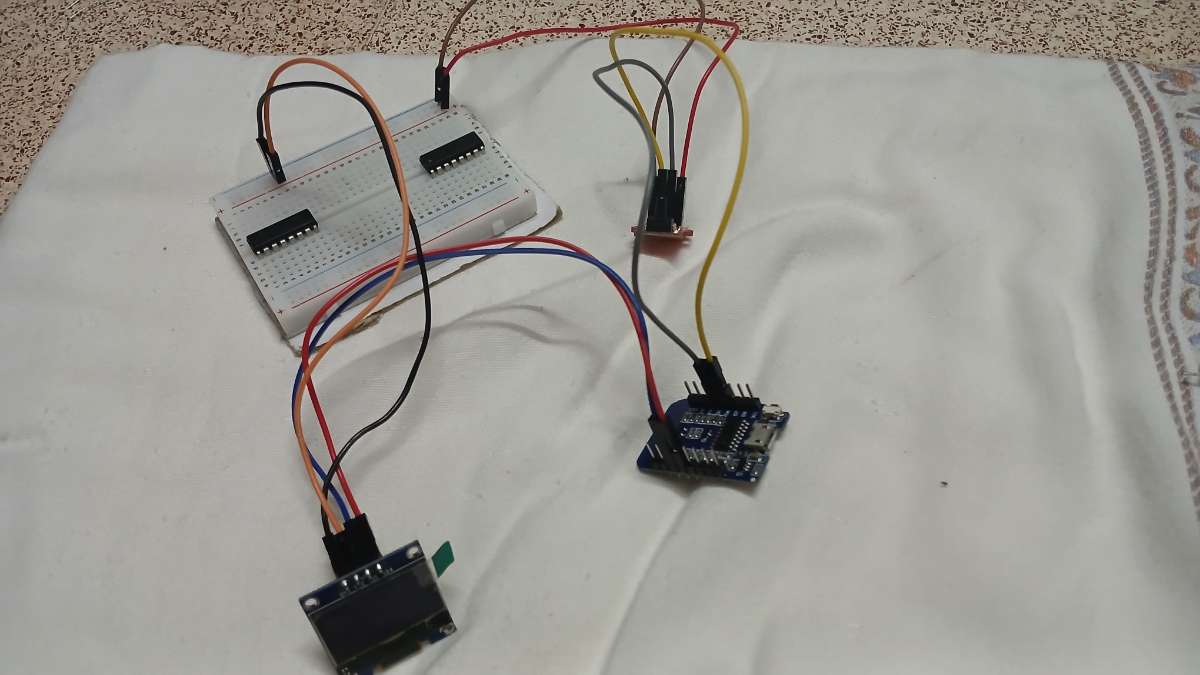
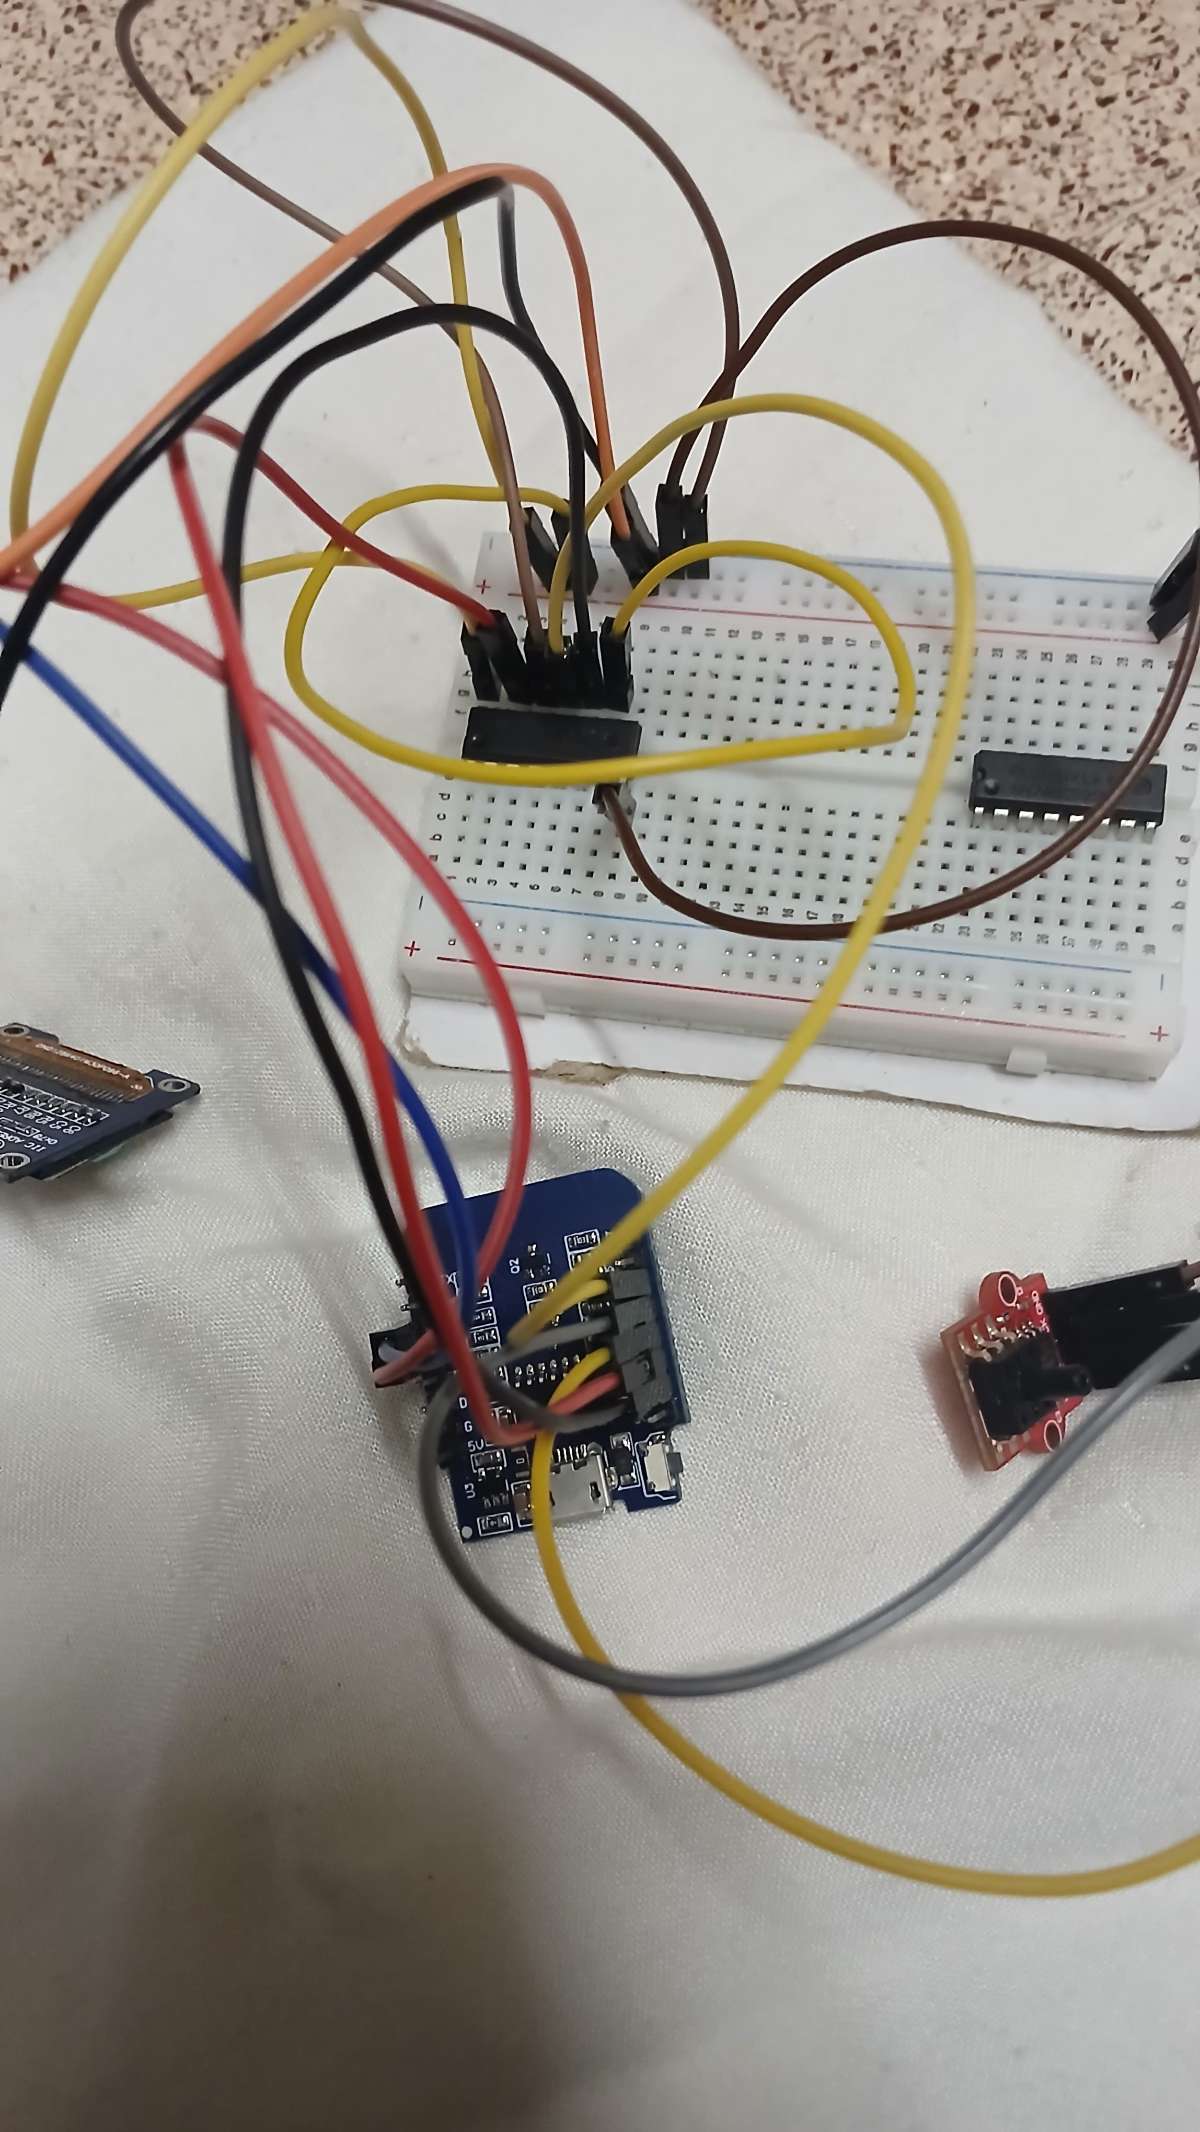
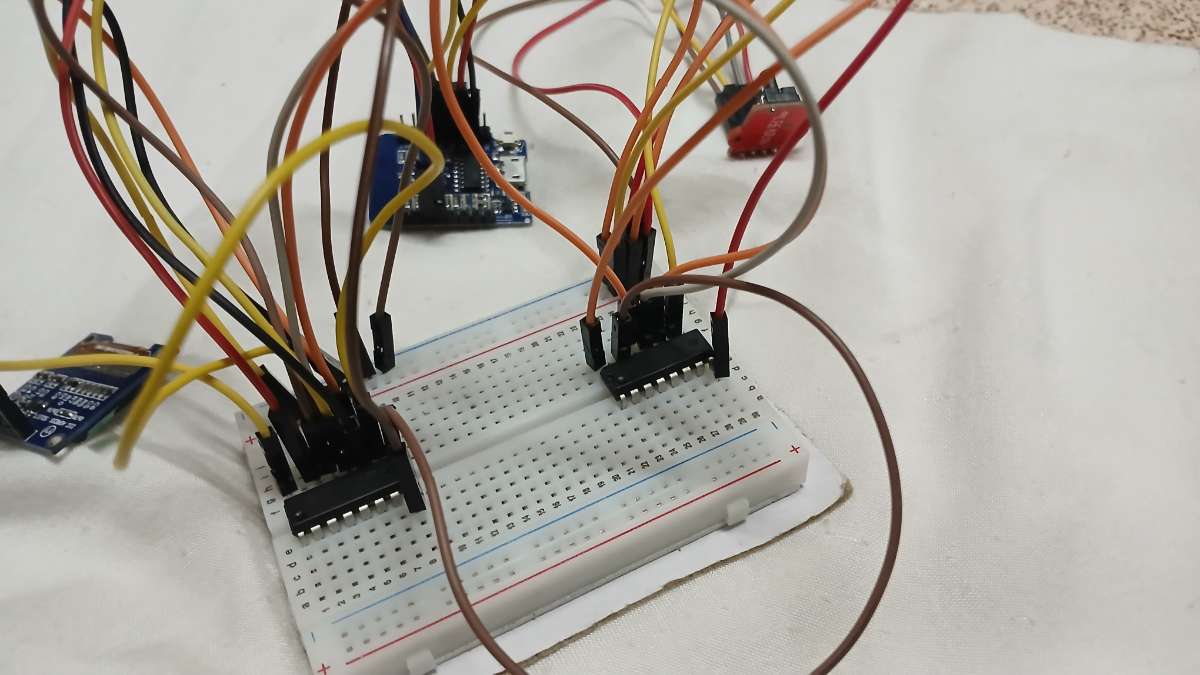
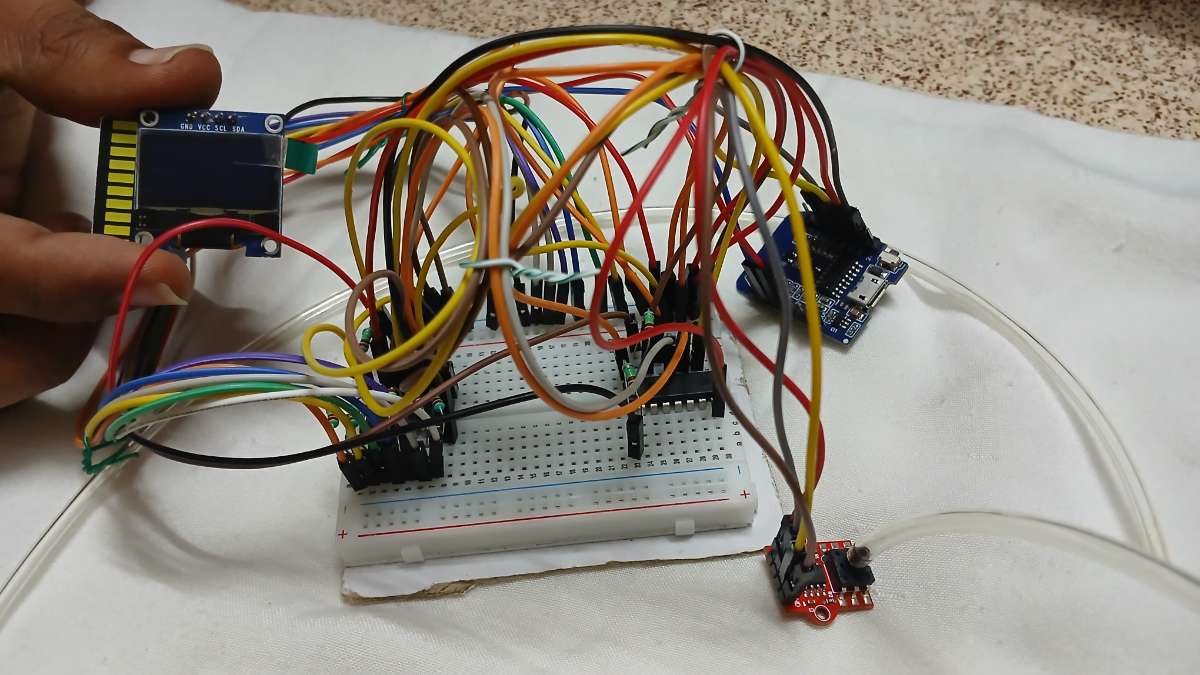
After Connection Wires:
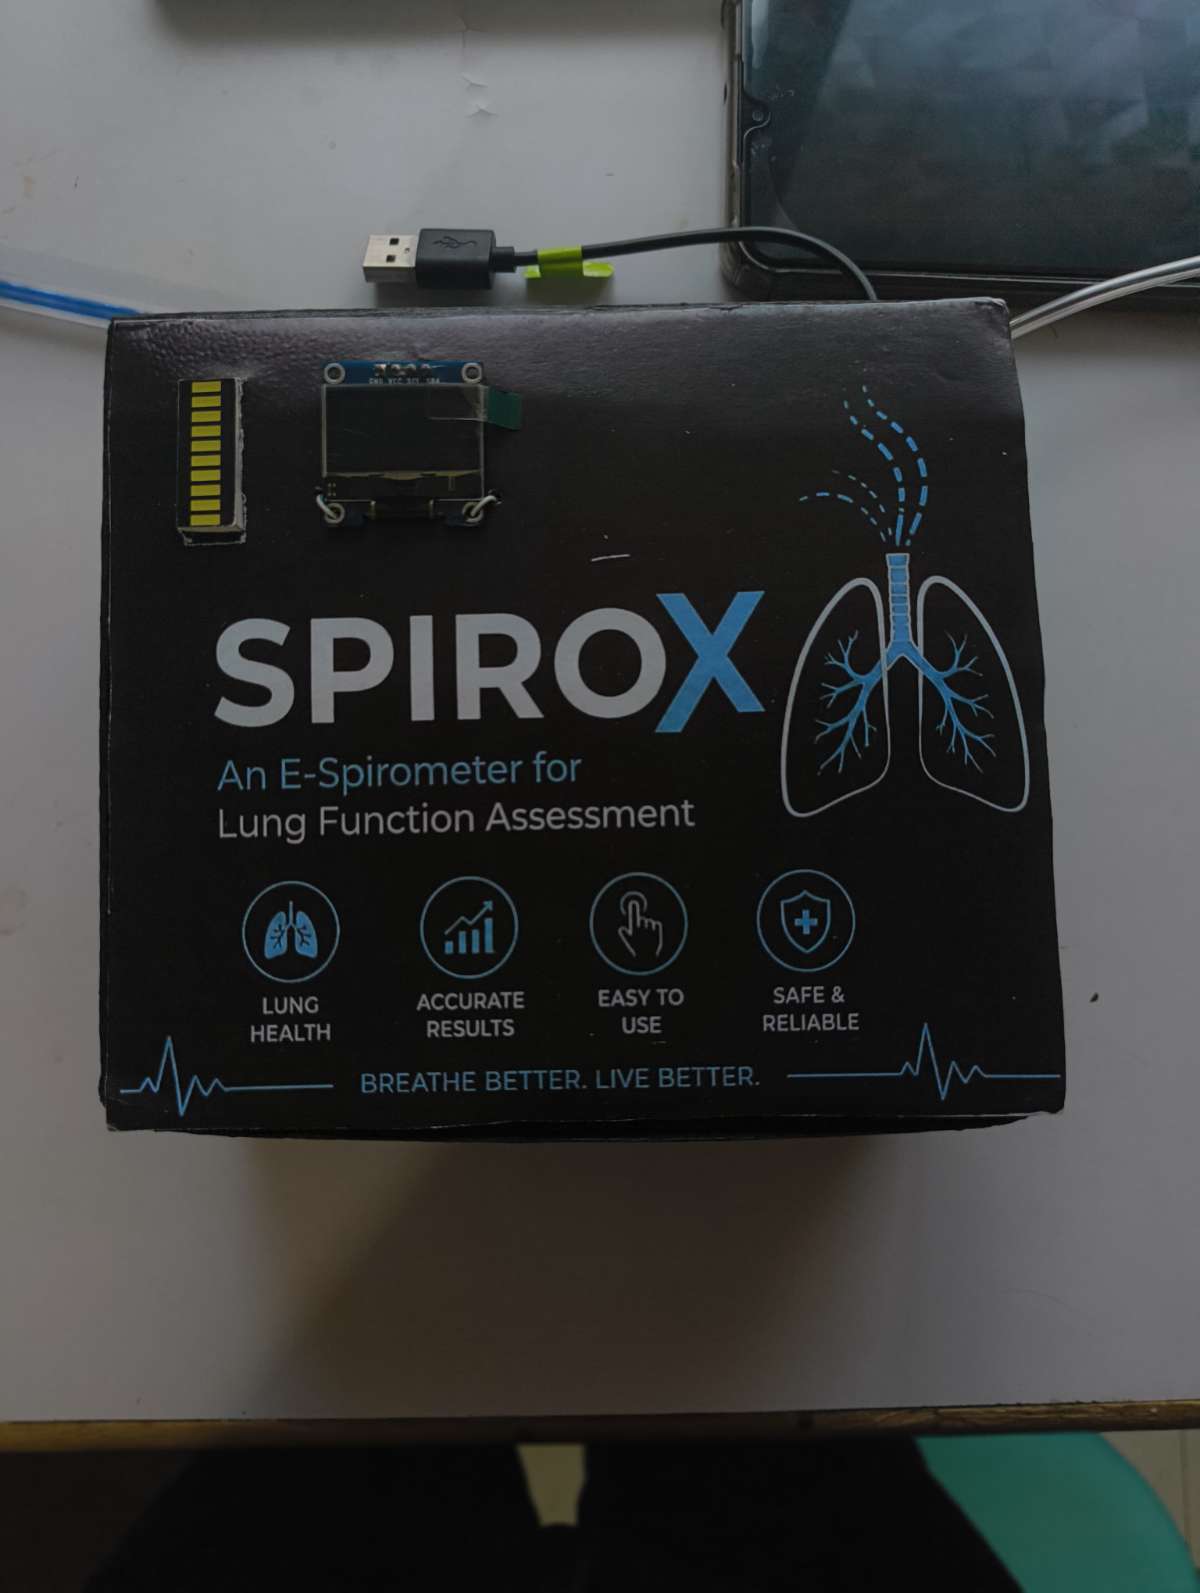
final Look:
Auduino IDE Code:
#include <Wire.h>
#include <Adafruit_GFX.h>
#include <Adafruit_SSD1306.h>

#define SCREEN_WIDTH 128
#define SCREEN_HEIGHT 64

Adafruit_SSD1306 display(SCREEN_WIDTH, SCREEN_HEIGHT, &Wire, -1);

// HX710B
#define HX_DT  D5
#define HX_SCK D6

// 74HC595
#define DATA_PIN  D7
#define CLOCK_PIN D8
#define LATCH_PIN D0

long zeroOffset = 0;

// ---------------- HX710B ----------------
long readHX710B()
{
  unsigned long startTime = millis();

  while (digitalRead(HX_DT))
  {
    if (millis() - startTime > 1000)
    {
      Serial.println("HX710B Timeout");
      return 0;
    }
    yield();
  }

  long value = 0;

  for (int i = 0; i < 24; i++)
  {
    digitalWrite(HX_SCK, HIGH);
    delayMicroseconds(1);

    value <<= 1;

    digitalWrite(HX_SCK, LOW);
    delayMicroseconds(1);

    if (digitalRead(HX_DT))
      value++;
  }

  digitalWrite(HX_SCK, HIGH);
  delayMicroseconds(1);
  digitalWrite(HX_SCK, LOW);

  value ^= 0x800000;

  return value;
}

// ---------------- LED BAR ----------------
void setLEDBar(int level)
{
  level = constrain(level, 0, 10);

  uint16_t data = 0;

  for (int i = 0; i < level; i++)
  {
    data |= (1 << i);
  }

  digitalWrite(LATCH_PIN, LOW);

  shiftOut(DATA_PIN, CLOCK_PIN, MSBFIRST, highByte(data));
  shiftOut(DATA_PIN, CLOCK_PIN, MSBFIRST, lowByte(data));

  digitalWrite(LATCH_PIN, HIGH);
}

// ---------------- SETUP ----------------
void setup()
{
  Serial.begin(115200);

  pinMode(HX_DT, INPUT);
  pinMode(HX_SCK, OUTPUT);

  pinMode(DATA_PIN, OUTPUT);
  pinMode(CLOCK_PIN, OUTPUT);
  pinMode(LATCH_PIN, OUTPUT);

  Wire.begin();

  if (!display.begin(SSD1306_SWITCHCAPVCC, 0x3C))
  {
    Serial.println("OLED FAIL");
    while (1);
  }

  display.clearDisplay();
  display.setTextColor(SSD1306_WHITE);

  display.setTextSize(2);
  display.setCursor(10, 20);
  display.println("SPIRO");
  display.display();

  delay(2000);

  // Zero calibration (ignoring failed reads)
  long sum = 0;
  int count = 0;

  for (int i = 0; i < 50; i++)
  {
    long v = readHX710B();
    if (v != 0)
    {
      sum += v;
      count++;
    }
    delay(20);
  }

  if (count > 0)
    zeroOffset = sum / count;
  else
    zeroOffset = 8388608; // Fallback midpoint

  Serial.print("Zero Offset = ");
  Serial.println(zeroOffset);
}

// ---------------- LOOP ----------------
void loop()
{
  long raw = readHX710B();
  if (raw == 0) return; // Skip read timeouts/failures to prevent giant pressure spikes

  // Raw difference
  long diff = abs(raw - zeroOffset);

  // ===== IMPORTANT =====
  // Adjust this factor so your strongest blow is ~4700 Pa
  float pressure = diff * 0.001;

  // Noise filter
  if (pressure < 5)
    pressure = 0;

  // LED level based on 0-4700 Pa (lights up first LED starting at noise threshold)
  int ledLevel = 0;
  if (pressure >= 5)
  {
    ledLevel = map((int)pressure, 5, 4700, 1, 10);
  }
  ledLevel = constrain(ledLevel, 0, 10);

  setLEDBar(ledLevel);

  // OLED Display
  display.clearDisplay();

  display.setTextSize(1);
  display.setCursor(0, 0);
  display.print("E-Spirometer");

  display.setCursor(0, 12);
  display.print("Pressure");

  display.setTextSize(2);
  display.setCursor(0, 24);
  display.print((int)pressure);

  display.setTextSize(1);
  display.print(" Pa");

  display.setCursor(0, 54);
  display.print("LED:");
  display.print(ledLevel);
  display.print("/10");

  display.display();

  Serial.print("Pressure = ");
  Serial.print(pressure);
  Serial.print(" Pa");

  Serial.print(" | LED = ");
  Serial.println(ledLevel);

  delay(50);
}
Pressure Level Mapping:
Pressure values are mapped into 10 levels:
Level 0–3 → Keep Practicing₹
Level 4–6 → keep Going
Level 7–9 → Good
Level 10 → Excellent
Features:
- Real-time pressure monitoring
- OLED live display
- 10-level LED visualization
- Portable and compact
- Low-cost spirometer
- Historical test tracking on website
- Easy to operate
Website Access for Jury:
- SPIROX includes a secure web dashboard for viewing lung function history and past test records.
- Website URL: https://spirox.onrender.com/
- Demo Login Credentials:
- Username: admin
Password: admin123 - These credentials are provided exclusively for the jury to access and evaluate the dashboard.
Advantages:
- Affordable compared to commercial spirometers
- Lightweight and portable
- Easy monitoring
- Useful for patients and doctors
- Data history available online
- Better graphical analytics website
Applications:
- Lung function assessment
- Respiratory monitoring
- Asthma detection support
- Clinical testing
- Home healthcare
- Medical education
Future Scope:
Future improvements may include:
- AI-based analysis
- Bluetooth support
- Mobile APK
- Advanced respiratory diagnosis
Conclusion:
SPIROX successfully demonstrates a smart and affordable spirometer for lung function assessment using pressure sensing technology. By combining the MPS20N0040D pressure sensor, HX710B ADC, and WeMos ESP8266, the system accurately measures breathing pressure and converts it into meaningful lung performance data.
The device provides real-time feedback through an OLED display and 10-level LED bar, allowing users to instantly visualize their breathing strength from weak to excellent. Its compact design, low cost, and ease of use make it suitable for healthcare monitoring, educational purposes, and clinical assessment.
In addition to hardware-based monitoring, SPIROX also includes a web dashboard for storing previous test records. The website maintains historical data and presents it using graphical representations such as charts and performance trends, enabling users and healthcare professionals to easily analyze progress, compare past results, and track long-term respiratory health.