VayuMate: A Handheld Device That Visualises Your Lung Health
Introduction:
I'm Ayushmaan, a B.Tech Electrical and Electronics Engineering student from India, and I build electronics projects around problems I actually run into rather than problems that look good on paper. The one that's impossible to avoid here is air pollution. Traffic exhaust, construction dust, industrial smoke, seasonal smog — bad air has quietly become part of daily life. Everyone talks about what it does to our lungs, but almost nobody has a simple, repeatable way to check what it's actually doing to their lungs.
You can feel your breathing get heavier on a bad air day. You can't see it. And anything you can't see is easy to underestimate.
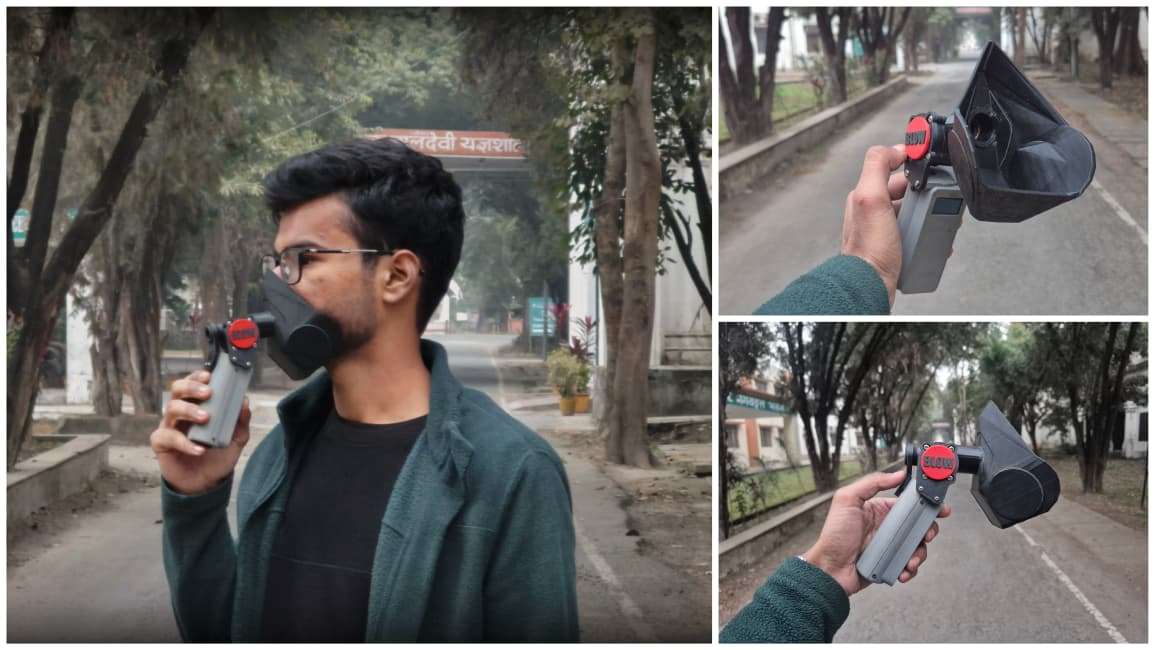
VayuMate is a small handheld device that tries to fix that gap — it captures your exhalation, turns it into a live graph and a Breathing Efficiency Score, and pairs that with your heart rate and blood oxygen so you get a fuller picture of what your body is doing during the test. It isn't a medical instrument and it doesn't pretend to be one. It's an awareness tool — something that makes lung performance concrete enough to track, compare, and actually think about.
Motivation Behind the Project:
The starting point wasn't "I want to build a spirometer." It was simpler than that: breathing is something we do without thinking about it tens of thousands of times a day, and we have almost no everyday feedback loop telling us how well we're doing it. Air quality indices tell you what's in the air around you, but they say nothing about how your own lungs are responding to it — and that response varies a lot from person to person, and for the same person, from day to day.
I wanted something that would let a person blow into a device for six seconds and walk away with a number and a graph that actually meant something to them personally — not a diagnosis, but a baseline they could check themselves against later. Relaxed breathing looks different from tired breathing. Post-exercise breathing tells its own story. Breathing on a smog-heavy morning versus a clear one is different too. None of that is visible unless you measure it consistently, and that's the gap VayuMate is built to fill.
Working Principle:
The core idea is straightforward: capture an invisible physiological process and turn it into something you can see and compare.
When you exhale into the mask attachment, the YF-S201 flow sensor measures how the air is moving through it — essentially how fast it's spinning a small internal turbine in response to airflow. That spin rate gets converted to digital pulses, which the ESP32 counts over the test window to build up an airflow profile across the full six seconds of the exhalation. While that's happening, the MAX30102 — sitting where a finger rests — reads heart rate and blood oxygen saturation (SpO₂) using photoplethysmography, giving extra physiological context for what the body is doing during the breath test.
Once the test window closes, the ESP32 processes the recorded airflow samples to extract three things: how strong the peak airflow was, how stable the flow stayed across the exhale, and how consistent the breath was overall. Those three numbers are weighted and combined into the Breathing Efficiency Score (0–100), which is the only number shown on the device itself. Everything else — the live graph, vitals, score history — goes to a companion web dashboard.
It's worth being explicit about what this is and isn't. It is not a clinical spirometer and it does not measure FEV1, FVC, or any of the standard pulmonary function metrics in a medically validated way. What it gives you is a consistent, repeatable, low-cost way to track your own relative breathing performance over time, using a methodology you understand because you built it (or are reading about how it was built).
Features:
- 6-second guided breathing test with live airflow sampling
- Computed Breathing Efficiency Score (0–100) based on peak flow, stability, and consistency
- Simultaneous heart rate and SpO₂ reading via the MAX30102
- On-device OLED feedback showing the final score
- Real-time web dashboard with a live airflow graph and detailed vitals
- Fully portable, battery-powered, USB-rechargeable design
- Reused and re-engineered 3D-printed enclosure from a previous project
Components Required:
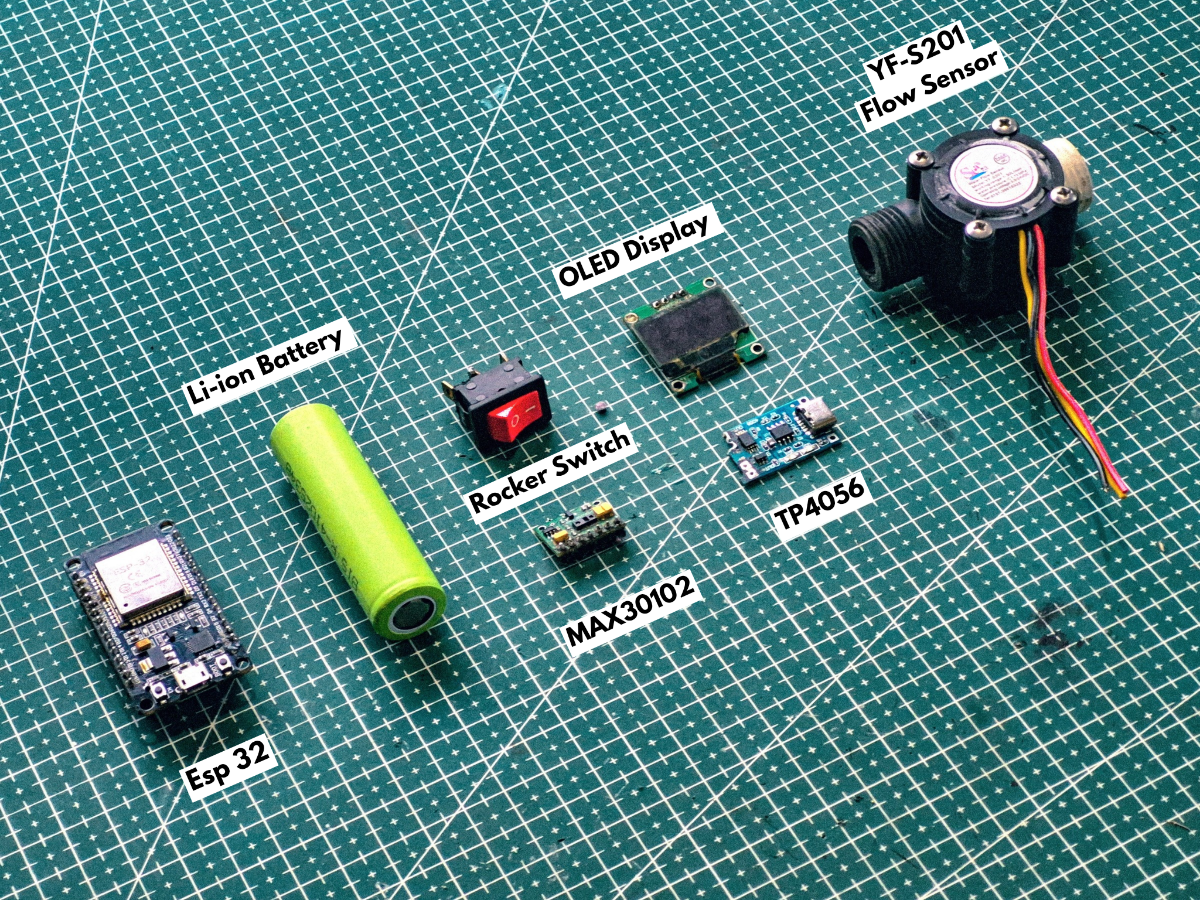
Electronics:
- ESP32 Development Board
- 0.96″ OLED Display
- YF-S201 Flow Sensor
- MAX30102 Pulse Oximeter Sensor (Heart Rate & SpO₂)
- Jumper Wires
- Perf Board
- Rocker Switch
- TP4056 Charging Module
- Li-ion Battery
Tools:
- 3D Printer
- Soldering Iron
- Soldering Wire
- Soldering Flux
- Screwdriver
- Hot Glue Gun
System Architecture:
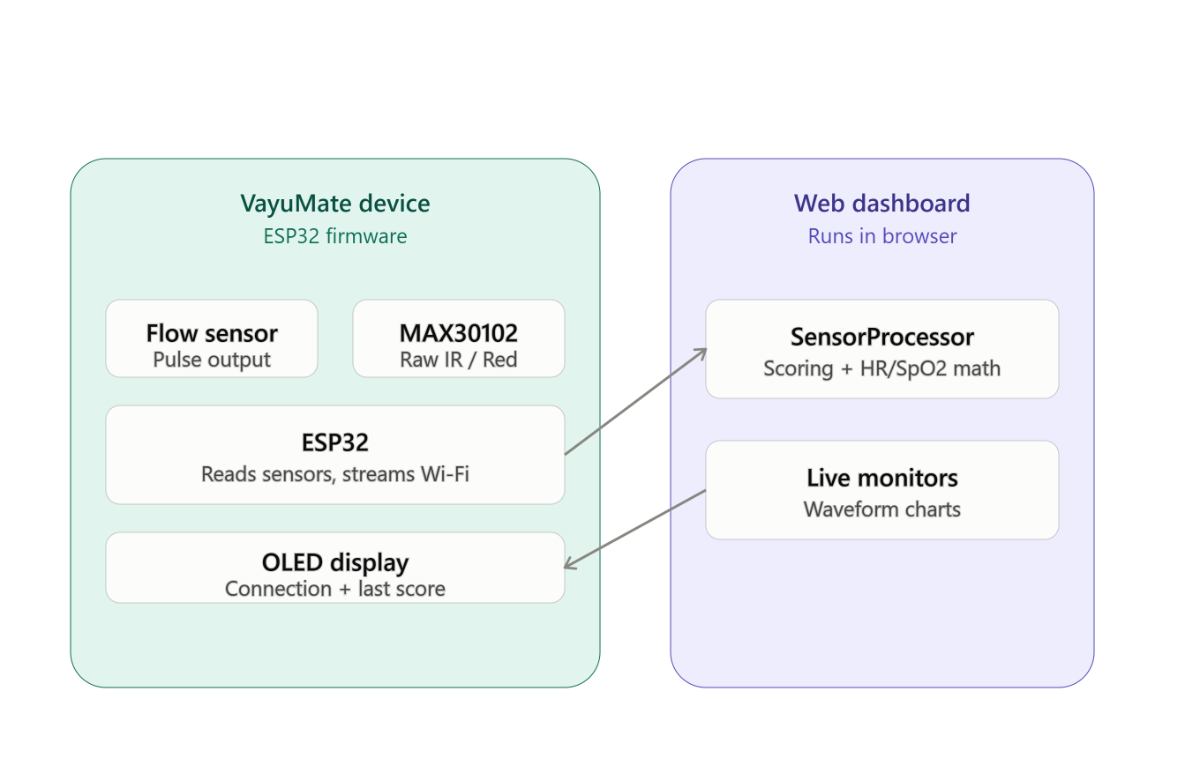
At a high level, VayuMate has three layers working together:
- Sensing layer — the YF-S201 flow sensor and the MAX30102, both feeding raw signal data to the ESP32.
- Processing layer — the ESP32, which handles pulse counting, the timed sampling window, score calculation, and driving the OLED.
- Visualization layer — split between the on-device OLED (which deliberately shows only the final score) and the web dashboard (which renders the full picture: live graph, vitals, and score).
I chose the ESP32 specifically because the project needed three things at once that a basic microcontroller like an Arduino Uno couldn't give me cleanly: enough I/O and interrupt capability to handle pulse counting from the flow sensor without missing pulses, a hardware I²C bus to run the OLED and MAX30102 simultaneously, and built-in Wi-Fi so the device could stream live data to the web dashboard without needing a separate networking module. Trying to bolt Wi-Fi onto an Uno would have meant extra hardware, extra wiring, and extra failure points — the ESP32 collapses all of that into one board.
Hardware Overview:
YF-S201 Flow Sensor — This is a Hall-effect based flow sensor: air (or in its usual application, liquid) spins an internal rotor, and a Hall-effect sensor on the shaft outputs a pulse train whose frequency is proportional to flow rate. It's normally sold for water-flow measurement, which means using it for breath airflow required treating its pulse output as a relative indicator of flow strength rather than relying on its factory-rated liquid-flow calibration. That's an important limitation to be upfront about: the sensor isn't characterized for air, so the calibration factor used in the firmware is a practical approximation, not a manufacturer-specified constant.
MAX30102 — An integrated pulse oximetry and heart-rate sensor module that uses red and infrared LEDs along with a photodetector to measure blood oxygen saturation and heart rate through the skin, typically via a fingertip. It communicates over I²C, which made it straightforward to share the same bus as the OLED display.
ESP32 — Handles all sensor reading, the timed test logic, score computation, OLED rendering, and Wi-Fi streaming to the dashboard.
0.96″ OLED Display — Kept deliberately minimal on the device side. Rather than trying to cram a graph onto a tiny monochrome screen, it shows just the final Breathing Efficiency Score, keeping the physical device simple to read at a glance.
TP4056 + Li-ion Battery — Power and charging, covered in detail in the Circuit Connections section below.
Circuit Connections:
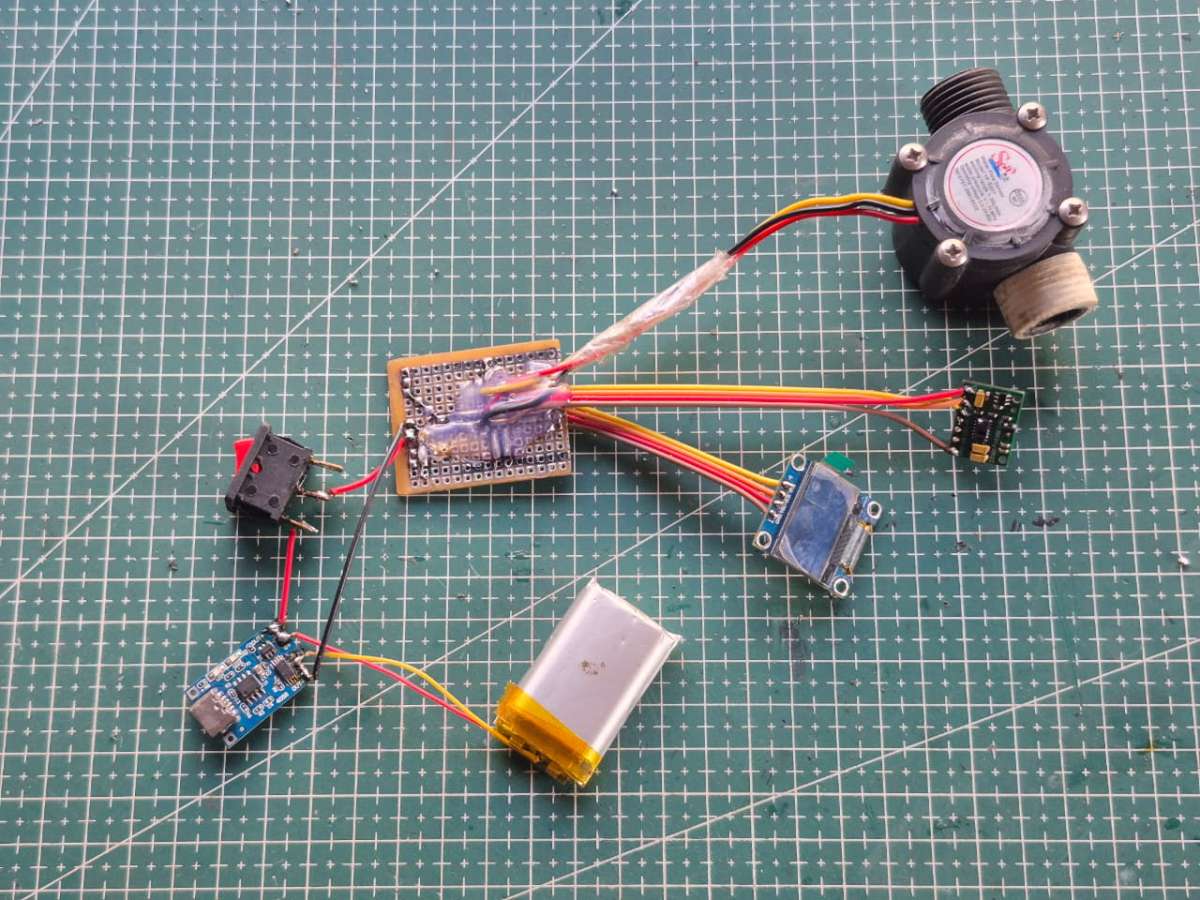
Instead of doing all the wiring directly inside the case, I first planned the entire circuit and built it on a perf board so the final setup would be compact, stable, and easy to manage. This approach also makes it much easier to convert the same layout into a proper PCB later.
To keep the process simple and organized, I broke this stage into the following parts:
1. Preparing the Perf Board Layout
.jpg)
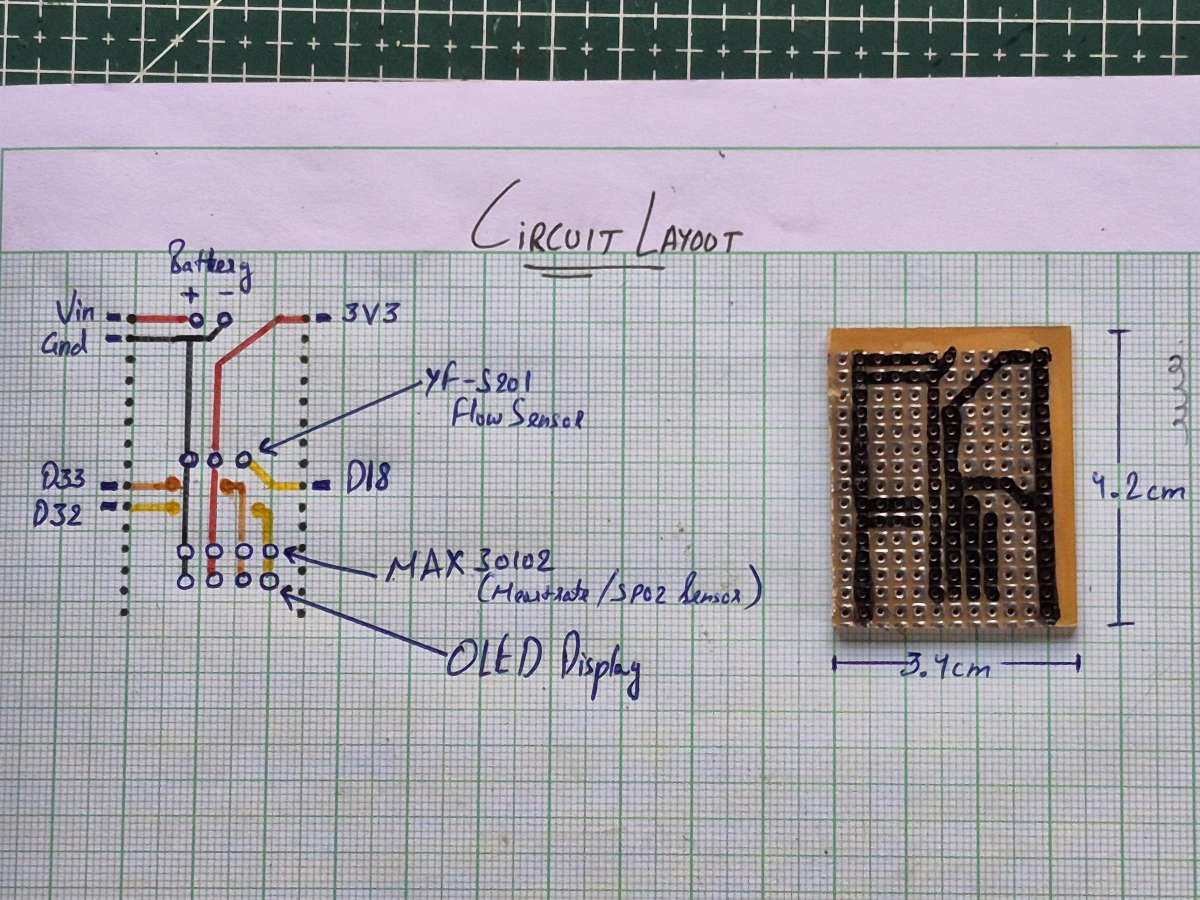
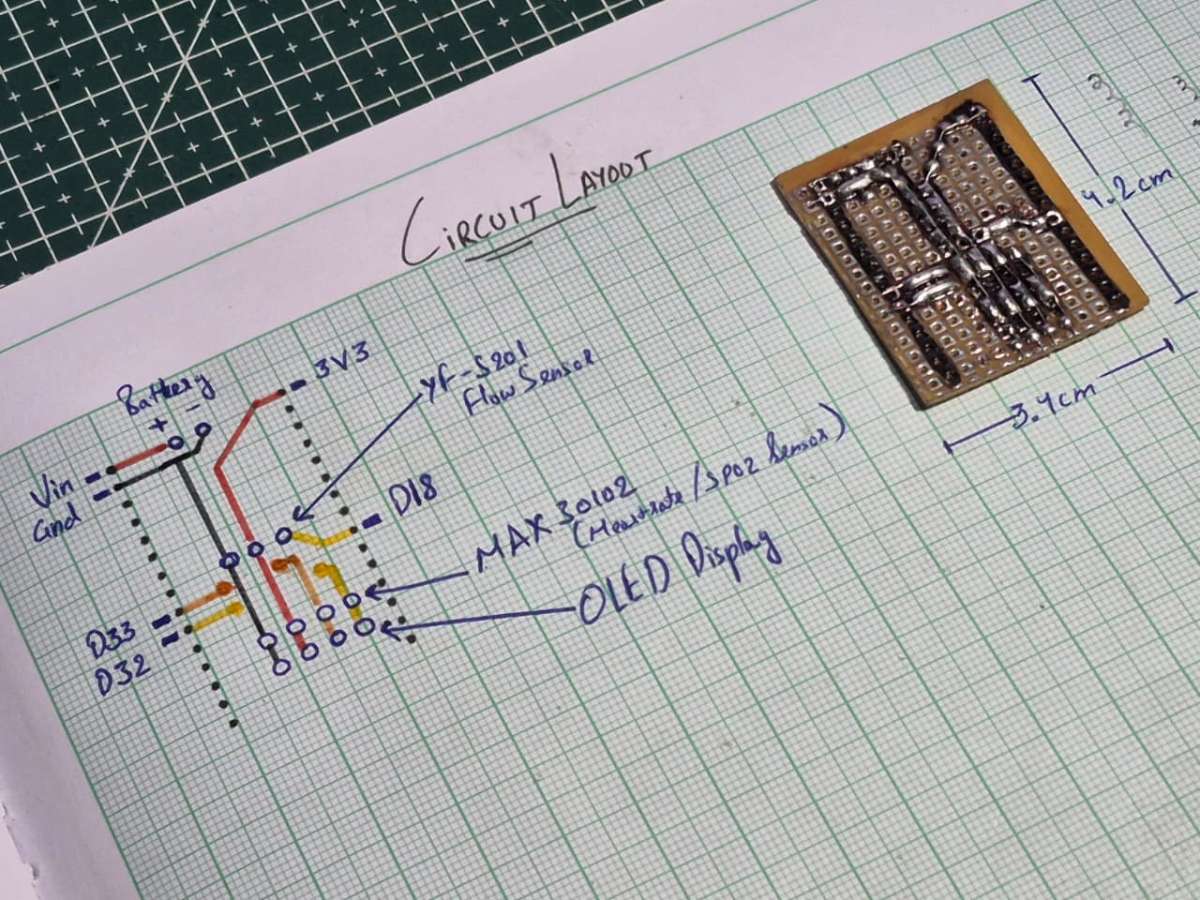
Before touching the soldering iron, I first planned the entire circuit on paper. This made it much easier to think about signal flow, power routing, and overall wire management before committing anything to the board.
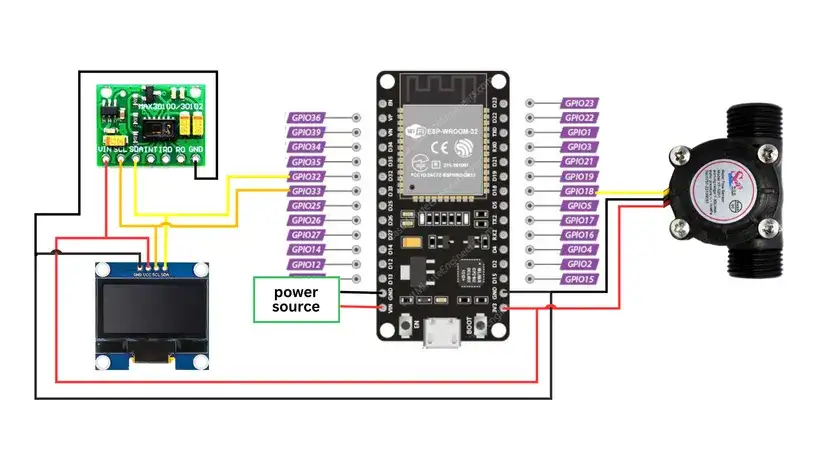
For the layout, I kept a common 3.3V line and a common ground line running through the board so that all components could share a clean power supply. The main connections were decided as follows:
- Power source connected to the ESP32 through VIN and GND
- 3.3V rail distributed from the ESP32 to the sensors and display
- D32 and D33 used as the I²C pins, shared between the OLED display and the MAX30102 sensor
- D18 assigned to the YF-S201 flow sensor signal line
With these core connections decided, I drew the full routing on graph paper, placing each component in a way that keeps the wiring short and avoids unnecessary crossings. This step saved a lot of time later and helped keep the final circuit neat and compact.
Once the layout looked good on paper, I cut the perf board to size and transferred the same design onto the board, marking the position of each major connection point before moving on to soldering.
2. Building the Circuit on the Perf Board
With the layout finalized, I started building the actual circuit on the perf board. I began by soldering the main power lines first — the common 3.3V rail and ground rail — since almost every component depends on these. This immediately gave the board a clear structure and made the rest of the wiring easier.
Next, I routed the signal connections according to the plan:
- D32 and D33 were connected to the shared I²C lines for the OLED display and the MAX30102 sensor
- D18 was routed to the YF-S201 flow sensor
- VIN and GND were connected to the incoming power from the battery and charging module
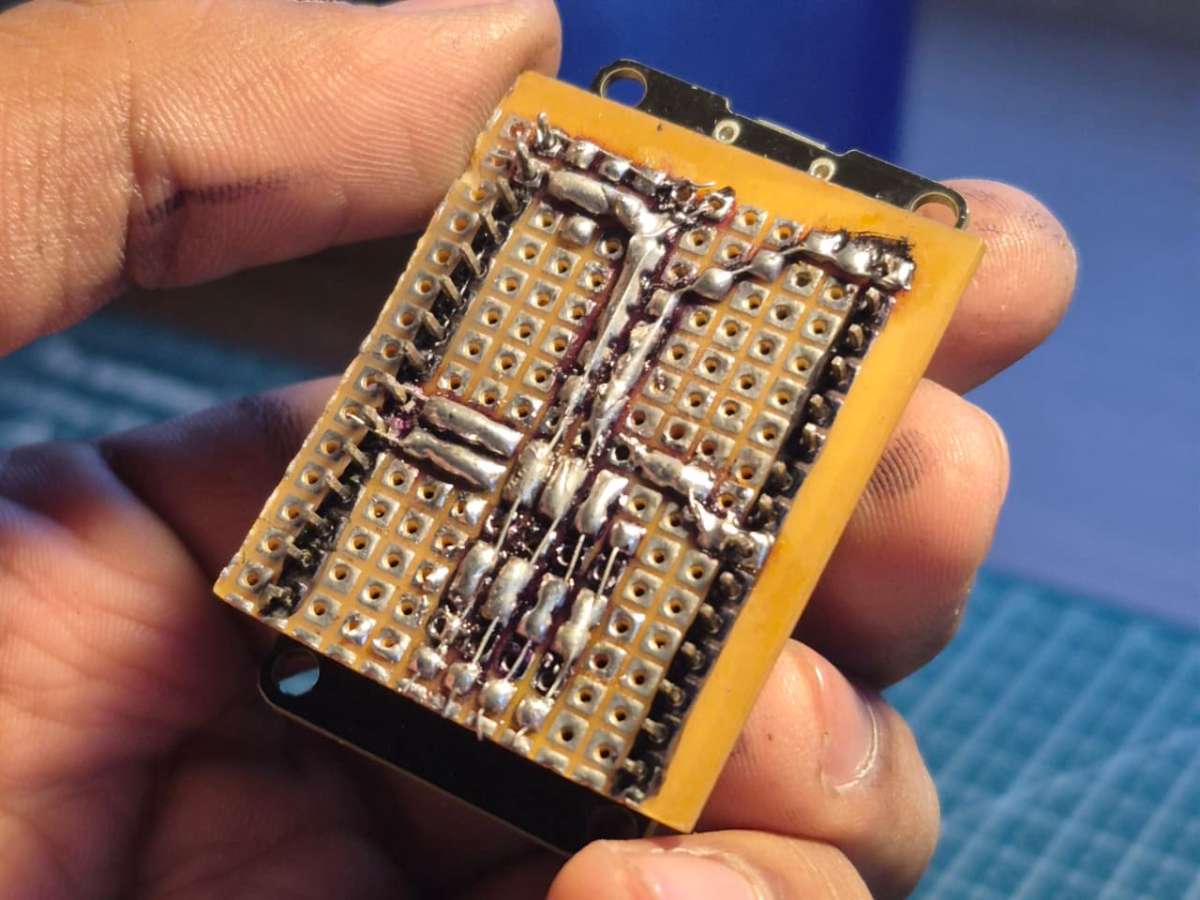
Instead of using long jumper wires, I created short, direct solder tracks on the back of the perf board. By carefully planning and shaping these solder paths, the board started to look and behave like a handmade PCB — compact, organized, and much more robust than typical prototype wiring.
After completing the soldering, I checked all connections for continuity and shorts. At this point, the circuit already felt solid and ready to move into the enclosure.
3. Power System Setup
Before connecting the rest of the components, I first set up the power system, since everything in the project depends on it working properly.
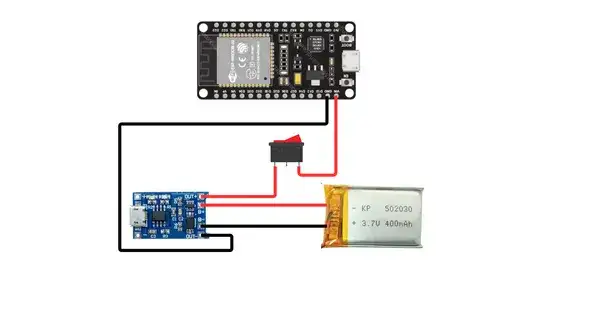
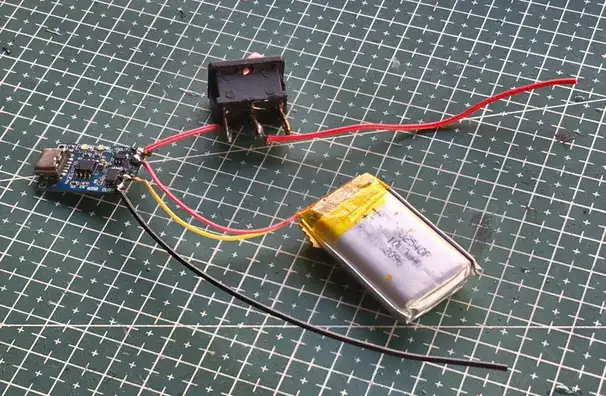
The device is powered using a Li-ion battery with a TP4056 charging module. This allows the battery to be charged safely using a standard USB cable while also powering the circuit.
The connections were done as follows:
- Battery → TP4056 (B+ and B− terminals)
- TP4056 OUT+ → VIN on ESP32
- TP4056 OUT− → GND on ESP32
- A rocker switch was placed in series with the main power line so the entire device can be turned on and off easily
This setup makes the device fully portable and rechargeable, which is important since it's meant to be handheld and used by different people.
4. Making the Final Connections
With the power system in place and the main board ready, I connected the remaining components to complete the circuit.
The YF-S201 flow sensor was connected to its signal line on D18, along with the shared 3.3V and GND rails from the board.
The OLED display and the MAX30102 sensor were connected to the shared I²C lines on D32 and D33, using the same power and ground lines.
After everything was wired, I powered the system and did a full check:
- ESP32 booted properly
- OLED display turned on
- MAX30102 responded on I²C
- Flow sensor output was registering correctly
Once all components were confirmed working, the circuit was complete and ready to be mounted inside the enclosure.
Sensor Working and Technical Details:
The YF-S201 is the sensor doing the real measurement work here. Internally it has a small plastic turbine wheel that rotates as air passes through it, and a Hall-effect sensor mounted near the shaft detects the passing magnets embedded in the rotor, generating one pulse per rotation (or a fixed number of pulses per rotation, depending on the magnet arrangement). The ESP32 counts these pulses over a known time window, and the pulse count translates into a flow value through a simple linear scaling factor.
Because the sensor's factory calibration is for water flow, not air, the calibration constant used in firmware (0.02 in the airflow conversion) is an empirically reasonable scaling factor rather than a datasheet value. This is one of the more honest limitations of the build: the absolute units of "airflow" reported by the device are relative, not an SI-calibrated CFM or L/min figure. What matters for the project's actual goal — tracking your own breathing pattern over time — is that the same sensor, same geometry, and same scaling factor are used consistently across every test, which keeps results comparable to each other even if they're not comparable to a clinical spirometer's output.
The MAX30102 works on a completely different principle — photoplethysmography. It shines red and infrared light into the fingertip and measures the light absorption changes caused by blood volume pulsing with each heartbeat. The ratio of absorption between the red and infrared wavelengths is what allows it to estimate SpO₂, while the periodicity of the absorption signal gives heart rate. It communicates over I²C, which is why it made sense to put it on the same bus as the OLED rather than wiring it up with dedicated GPIO.
ESP32 Implementation:
This is the point where the project's architecture changed from the original version, and it's worth explaining why before getting into the code.
The first working version of VayuMate did everything on the ESP32 — pulse counting, the 6-second sampling window, peak/stability/consistency scoring, even reading the MAX30102's heart rate and SpO2 — and only handed the device a final number to display. That worked, but it meant every change to the scoring logic meant reflashing the board, and the OLED was the only place you could see anything beyond the final score.
I rebuilt it so the ESP32 does as little thinking as possible. Its job now is just to read both sensors as cleanly as it can and stream the raw values over Wi-Fi. All the scoring, the breathing test window, and the HR/SpO2 estimation moved into the browser, in a companion web dashboard. The firmware's responsibilities collapsed down to three things running continuously, not five running once per test:
- Counting flow-sensor pulses on an interrupt
- Reading raw IR/Red samples from the MAX30102
- Pushing both out over a WebSocket, plus reflecting connection and test status on the OLED
Reading the Flow Sensor:
The flow sensor's signal line is still on D18, still configured as an interrupt pin — that part didn't change. Every pulse increments a counter inside an interrupt service routine:
cpp:
volatile uint32_t pulseCount = 0;

void IRAM_ATTR flowPulseISR() {
  pulseCount++;
}

uint32_t consumePulses() {
  noInterrupts();
  uint32_t count = pulseCount;
  pulseCount = 0;
  interrupts();
  return count;
}
Using an ISR here rather than polling matters for the same reason it always did — pulse timing is fast and irregular relative to the rest of the loop, and polling risks missing transitions whenever the loop is busy doing something else, like servicing the WebSocket or redrawing the OLED. volatile on pulseCount keeps the compiler from optimizing away reads of a variable that's being modified asynchronously by the interrupt. The one real change is that consumePulses() wraps the read-and-reset in noInterrupts()/interrupts(), since on a 32-bit counter shared between the ISR and the main loop, that's a slightly safer pattern than the original 16-bit int version — worth doing now that this runs continuously rather than once per test.
What's gone is the * 0.02 calibration math and the L/min conversion. The ESP32 now hands off the raw pulse delta untouched; the calibration factor lives in the dashboard's SensorProcessor instead, which means I can tune it without touching the firmware at all.
Software Logic and Data Processing
Continuous Streaming, Not a Fixed 6-Second Loop:
The biggest structural change is that the firmware no longer blocks inside a while (millis() - startTime < 6000) loop to run the test. That loop was simple, but it stalled the rest of the firmware for the full 6 seconds — no WebSocket servicing, no OLED updates, nothing else could happen while a test was running.
Instead, the ESP32 streams continuously, all the time, whether a test is "in progress" or not:
cpp:
const unsigned long STREAM_INTERVAL_MS = 60; // ~16 packets/sec   unsigned long lastStreamAt = 0;

void loop() {
  webSocket.loop();
  unsigned long now = millis();

  if (now - lastStreamAt >= STREAM_INTERVAL_MS) {
    lastStreamAt = now;
    streamSensorPacket();
  }
  // OLED update on its own interval, same idea   }
The 6-second breathing test window still exists — it's just enforced on the dashboard side now. The browser starts buffering incoming flow samples when you press "Start Breathing Test," stops at 6 seconds, and runs the scoring math on whatever arrived in that window. The ESP32 doesn't know or care that a test is happening except for a small status flag it gets told about over the socket, used only to update what the OLED shows.
This ends up being more robust than the original blocking loop: if a packet gets dropped over Wi-Fi, the test isn't ruined, since the dashboard is just buffering a continuous stream rather than depending on the ESP32 successfully completing an uninterrupted 6-second loop.
Flow Rate Calculation Method:
The scoring formula itself didn't change — peak airflow at 40%, stability at 30%, consistency at 30%, the same reasoning as before: a strong exhalation is the clearest single signal of lung performance, while stability and consistency capture whether the breath stayed controlled rather than spiking and dropping erratically. What changed is where it runs:
js:
// now lives in the dashboard, not the firmware   scoreFromSamples(samples) {
  const peak = /* derived from max sample */;
  const stability = /* derived from standard deviation vs mean */;
  const consistency = /* derived from sample-to-sample variance */;
  const score = Math.max(0, Math.min(100,
    peak * 0.4 + stability * 0.3 + consistency * 0.3
  ));
  return score;
}
Moving this to JavaScript also let me add something the original firmware didn't have: outlier rejection on the raw flow values before they ever reach the scoring math. The YF-S201's Hall-effect output can register a spurious extra pulse from mechanical bounce, which used to show up as a flow spike feeding directly into getPeak(). The dashboard now clamps any jump larger than a sane physical limit between consecutive samples and runs a short moving average before the value is used for scoring or displayed on the graph — so a single bounced pulse damps out instead of skewing the peak-flow component of the score.
OLED Interface Design:
The OLED still shows the score, but it's no longer the thing computing it — it's just displaying whatever the dashboard tells it, over the same WebSocket the sensor data goes out on:
cpp:
void drawReadyScreen() {
  display.clearDisplay();
  display.setCursor(0, 0);
  display.println("VayuMate");
  display.print("IP: "); display.println(WiFi.localIP());
  display.print("Dashboard: ");
  display.println(clientConnected ? "CONNECTED" : "WAITING");

  if (testInProgress) {
    display.print("Test running: ");
    display.print(secsLeft); display.println("s");
  } else if (lastReceivedScore >= 0) {
    display.setTextSize(2);
    display.print("Score:");
    display.print(lastReceivedScore);
  }
  display.display();
}
This was a deliberate trade-off, same as it was originally — a 0.96″ monochrome OLED was never going to render a usable live graph, so the device gives you the glanceable essentials (IP address to connect to, whether the dashboard is actually listening, a countdown while a test runs, the last score it was told about) and leaves anything that benefits from more screen and color to the web dashboard. The difference now is that the OLED is honestly just a thin status display — every number on it originates somewhere else, either as raw sensor data it's relaying or as a result it's been handed back after the dashboard finishes the math.
Web Dashboard Implementation:
Once the ESP32 was reduced to a raw data source, I needed something on the other end actually catching that data and doing something with it. I built this as a single self-contained HTML file — no build step, no framework, no server-side component. The whole thing runs entirely client-side: open it in a browser, and the browser itself becomes the processing backend. That was a deliberate choice rather than an oversight — for a personal lung-tracking tool used by one person at a time on their own network, standing up a separate backend server to relay data that's already going straight from the ESP32 to the browser would have been unnecessary infrastructure for no real benefit.
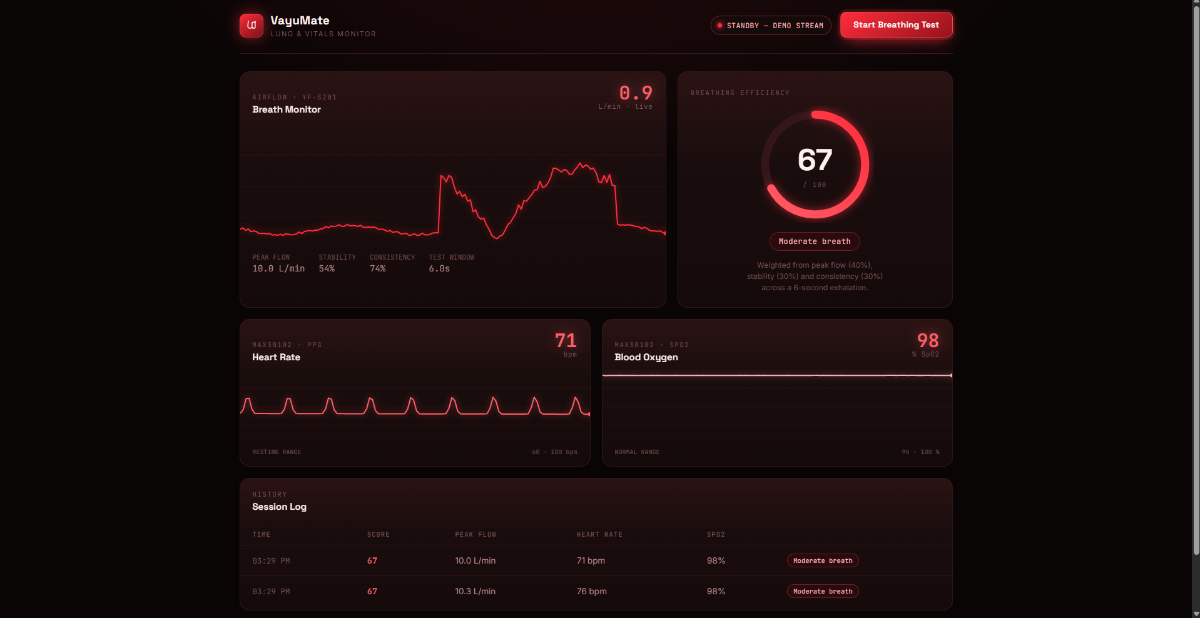
Design direction:
I wanted the dashboard to feel less like a generic admin panel and more like an actual clinical vitals monitor — dark background, red glow instead of the usual hospital green, and scrolling waveform panels for breath, heart rate, and SpO2 that all share one consistent rendering style rather than three mismatched chart widgets bolted together. Space Grotesk for the big numbers, JetBrains Mono for the live readouts, since a monospace face is what makes numeric data feel like an instrument reading rather than UI copy.
SensorProcessor — where the math actually lives now:
This is the module that absorbed everything the old firmware used to do:
js:
const SensorProcessor = {
  FLOW_CAL: 0.02, // same calibration factor as the original getAirflow()
  pulsesToFlow(pulseDelta) {
    // converts raw pulse counts into a flow reading, with outlier       // clamping and a short moving average to damp mechanical-bounce       // glitches before the value is scored or drawn     },

  scoreFromSamples(samples) {
    // same peak*0.4 + stability*0.3 + consistency*0.3 formula as       // the original firmware, just running on whatever samples the       // browser buffered during the 6-second test window     }
};
The 6-second test window is now enforced in JavaScript rather than in a blocking ESP32 loop: pressing "Start Breathing Test" begins buffering incoming flow values, a setTimeout closes the window at 6 seconds, and scoreFromSamples() runs on whatever arrived in that span.
A shared waveform renderer instead of three different charts:
Rather than reaching for a charting library and getting three visually distinct widgets, I wrote one small Monitor class that draws a scrolling, glowing waveform on a canvas, and instantiated it three times — once each for breath, heart rate, and SpO2:
js:
class Monitor {
  constructor(canvas, opts) {
    this.buffer = [];
    this.color = opts.color;
    this.bufferLen = opts.bufferLen || 180;
  }
  push(val) { this.buffer.push(val); /* trim to bufferLen */ }
  draw() {
    // scrolling line with a glow effect and a leading dot,       // same visual language across all three panels     }
}
That's what makes the three vitals panels read as one instrument rather than three unrelated charts dropped onto a page.
Connecting the dashboard to the device:
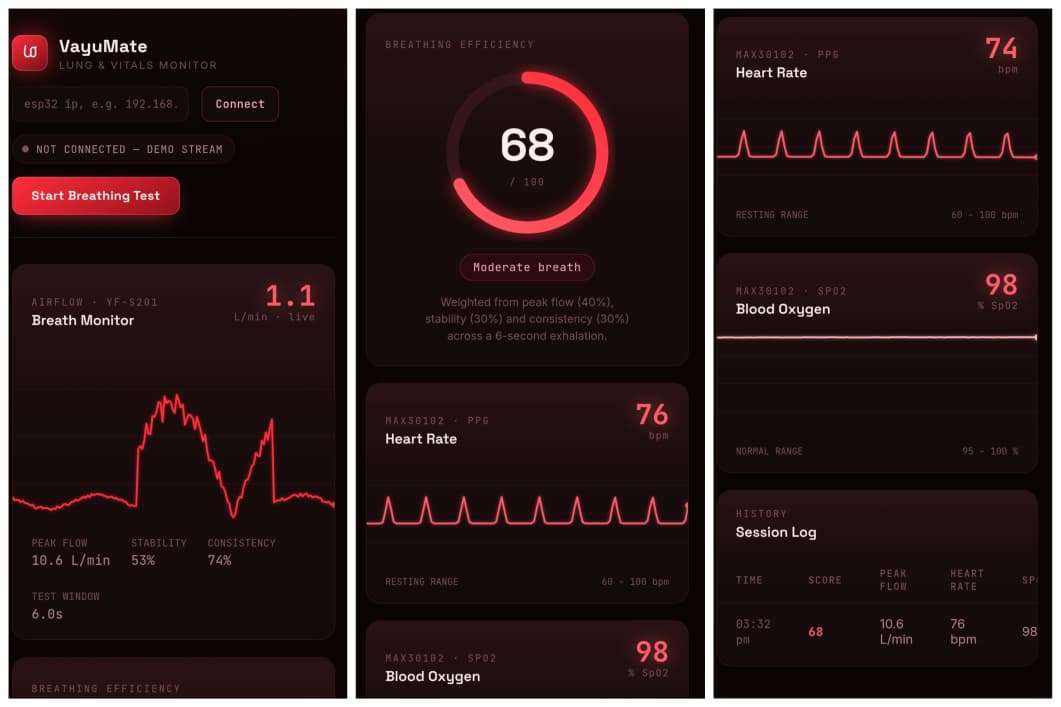
The dashboard's header has an IP input field and a Connect button — there's no hardcoded address baked into the code, since the ESP32's IP can change between sessions depending on the router. The flow is:
- Flash the ESP32 firmware and check the Serial monitor (or the device's own OLED, which shows it once Wi-Fi connects) for its assigned IP address.
- Open the dashboard in a browser, type that IP into the field, and hit Connect.
- The page opens a WebSocket to
ws://<that-ip>:81— the same port the firmware'sWebSocketsServeris listening on. - The moment real packets start arriving, a synthetic demo signal that runs by default (so the UI is fully testable without hardware attached) shuts off automatically, and every panel switches to live data.
- If the socket closes or the device goes quiet for a few seconds, the dashboard says so explicitly and drops back to the demo stream rather than silently displaying stale numbers.
One networking detail worth flagging if you deploy this rather than just opening the file locally: browsers block plain ws:// connections from a page served over HTTPS as mixed content. Since the ESP32 only speaks unencrypted WebSocket, the dashboard needs to be served over plain HTTP (which is the normal case for something accessed on a local network) — setting up wss:// would mean getting a certificate onto the ESP32 itself, which is more complexity than it's worth for a device that never leaves your home Wi-Fi.
Enclosure Design and Fabrication:
.png)
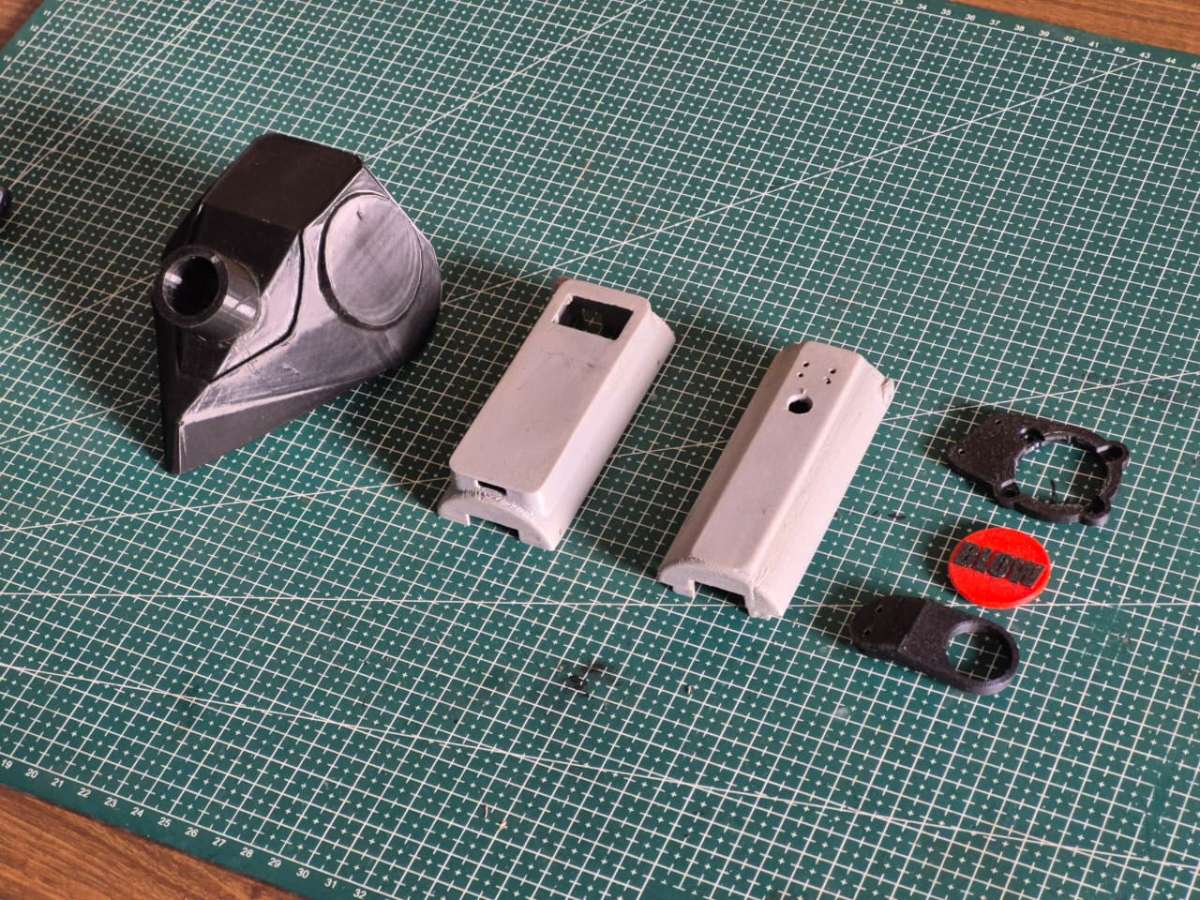
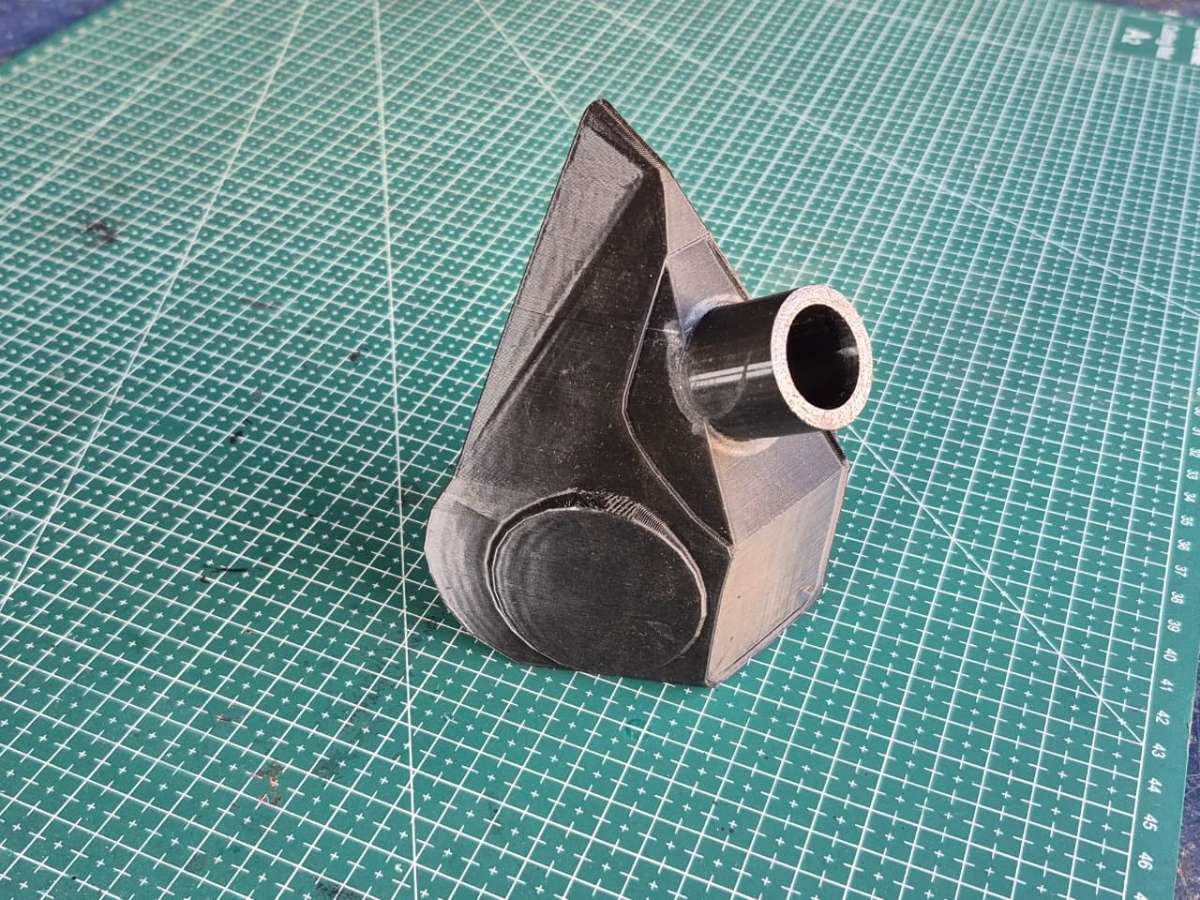
For the body of the device, I didn't start from zero. I reused and modified one of my older projects called Pour-fect. The original version was built as a digital funnel, and the shape, grip, and internal layout already worked well, so it made sense to evolve that design instead of building a new case from scratch.
The biggest change this time was at the front. Since this project depends on people blowing air into the device, I added a mask-style attachment that sits in front of the YF-S201 flow sensor. This helps guide the air properly into the sensor and also keeps the user's face at a comfortable distance from the electronics.
Inside, the project still uses the same core electronics from the earlier version — the ESP32, OLED display, battery, and charging module — because they were already doing their job well. I mainly reorganized things to fit the new function of the device and added the MAX30102 sensor for heart rate and oxygen measurement.
This approach saved time, reused working hardware, and turned an existing project into something new with a completely different purpose.
Assembly Process:
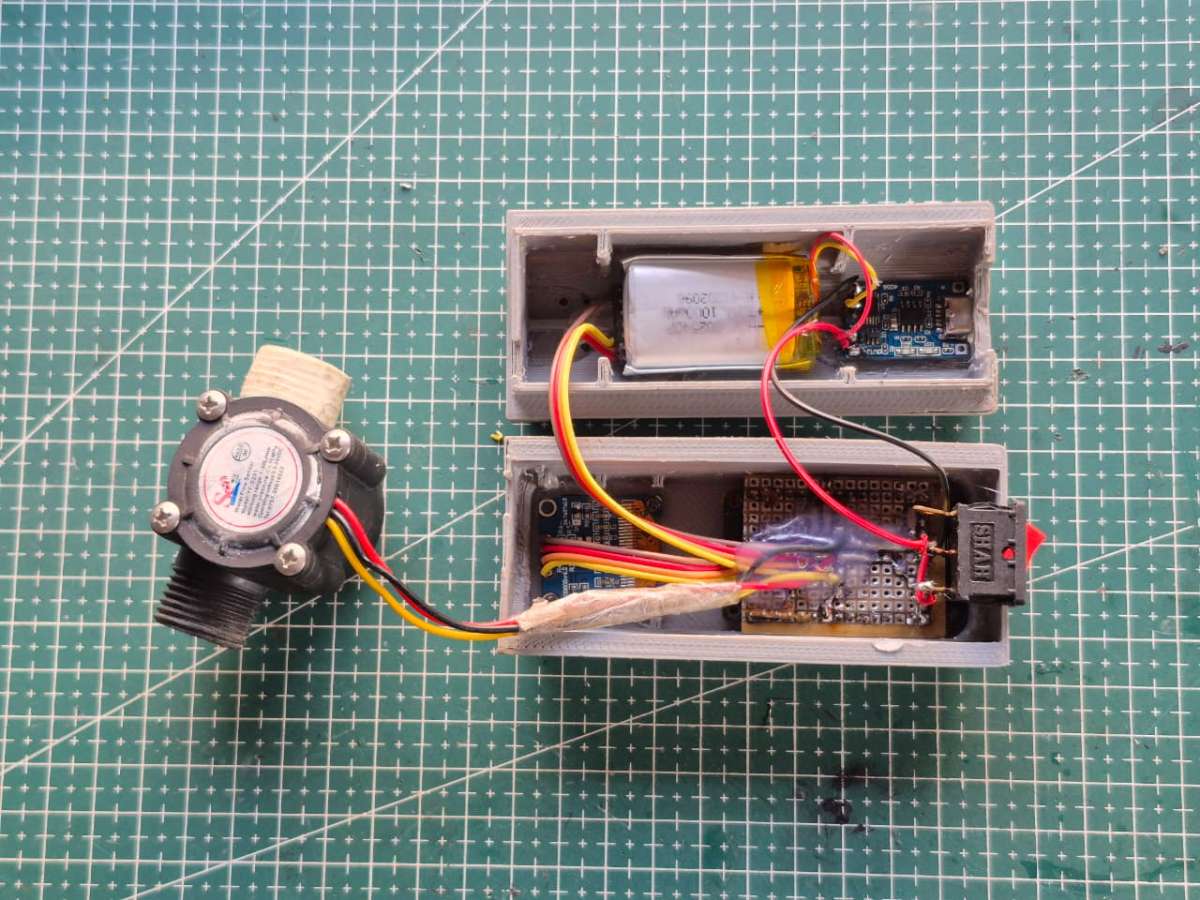
Once the electronics were working properly on the bench, it was time to bring everything together inside the enclosure.
I started by mounting the perf board into the main body of the case and fixing it in place so it wouldn't move around during use. Next, I installed the OLED display into the front opening and secured it from behind. The MAX30102 sensor was positioned where a finger could comfortably rest on it, and the flow sensor was aligned with the front mask attachment to ensure proper airflow during the breathing test.
The Li-ion battery and TP4056 charging module were placed in the lower section of the enclosure, and the rocker switch was fixed into its slot on the side. All the wiring was arranged neatly and kept clear of the airflow path before closing the case.
After everything was in place, I closed the enclosure, powered the device on, and ran one final check to make sure:
- the display was clearly visible,
- the sensors were responding correctly,
- the airflow path was unobstructed,
- and the device felt comfortable and solid in the hand.
At this point, the project was no longer just a collection of parts — it had become a complete working device.
Testing and Calibration:
Testing happened in two stages. The first was the bench-level electrical check described in the circuit section: confirming the ESP32 booted, the OLED displayed correctly, the MAX30102 responded over I²C, and the flow sensor registered pulses on exhale. Only once those four things were confirmed did the board go into the enclosure.
The second stage was functional testing of the actual breathing test cycle — running the full 6-second sampling window, watching the airflow array populate, and verifying the score calculation produced sensible, repeatable results across multiple breaths from the same person. This is where the practical limitation of the flow sensor's calibration becomes most relevant: because the YF-S201 is rated for water flow rather than air, the 0.02 scaling factor in getAirflow() was arrived at empirically rather than pulled from a datasheet. It's good enough to produce consistent, comparable scores test to test, but it isn't a substitute for a properly calibrated spirometric instrument, and I'm upfront about that distinction throughout this build.
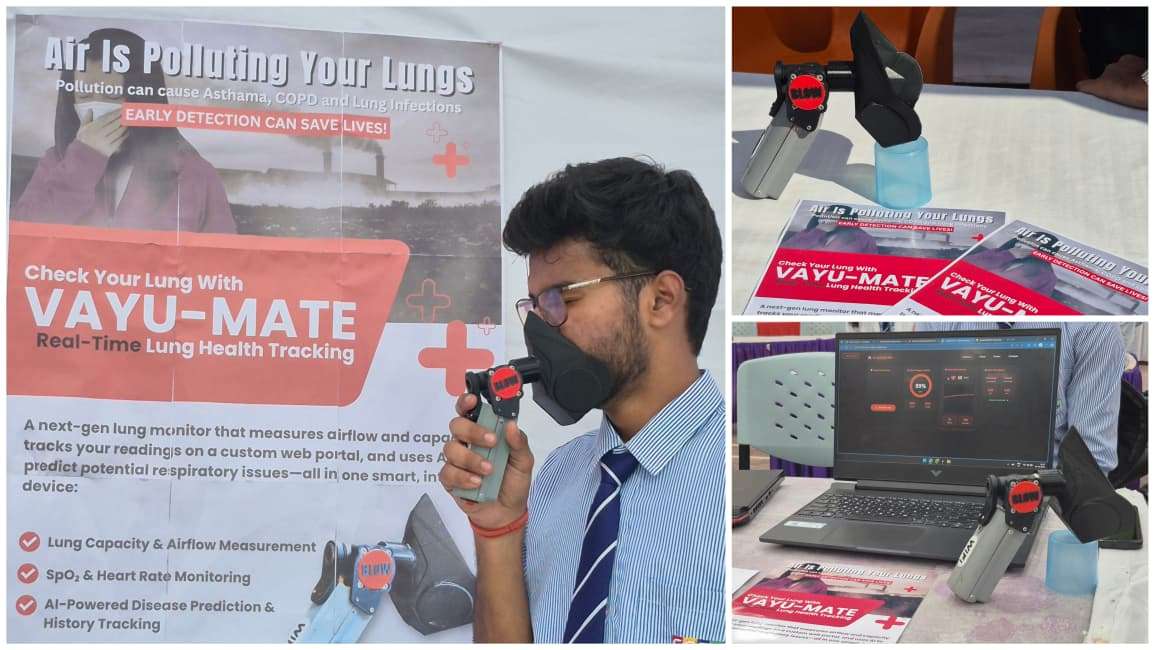
Results and Observations:
In practice, the device does what it set out to do: it converts six seconds of breathing into a graph and a score that are actually easy to interpret. Stronger, steadier exhalations score visibly higher than weak or erratic ones, which lines up with what you'd expect subjectively. Pairing the breathing data with heart rate and SpO₂ from the MAX30102 adds useful context — you can see, for example, whether a low score corresponds to elevated heart rate (suggesting fatigue or exertion) versus a calm, resting state.
The web dashboard turned out to be the more valuable half of the project in practice. Watching the airflow graph build in real time on your phone, rather than just seeing a static number on the OLED, makes the whole test feel less like a one-off measurement and more like something you'd actually want to repeat and track over days or weeks.
Challenges Faced and Solutions:
Flow sensor calibration for air, not water. The YF-S201 is designed and rated for liquid flow, so there was no off-the-shelf calibration constant for air. I treated this pragmatically — using a fixed scaling factor and focusing on relative, repeatable measurements rather than chasing absolute accuracy I couldn't actually validate without lab-grade reference equipment.
Sharing the I²C bus cleanly. Putting the OLED and MAX30102 on the same I²C lines (D32/D33) meant making sure both devices' addresses didn't conflict and that bus timing stayed reliable with two devices pulling data. Keeping the wiring short on the perf board (rather than relying on long jumper runs) helped keep the bus electrically clean.
Reusing an existing enclosure for a new purpose. Pour-fect's case wasn't designed with a breath-test mask in mind, so the front-end redesign — adding the mask attachment and aligning it with the flow sensor — took more iteration than the rest of the mechanical work, since airflow needed to be guided consistently into the sensor without leaking around the edges.
Keeping the on-device UI simple without losing detail. Cramming a live graph onto a 0.96″ OLED wasn't realistic, so the decision to split functionality — score on-device, full detail on the dashboard — solved a UI problem that no amount of OLED library tweaking would have fixed cleanly.
Future Improvements:
This project represents an early step rather than a finished product. The areas I'd want to improve most:
- More rigorous calibration of the flow sensor's airflow conversion, ideally cross-checked against a reference flow source
- A larger dataset across more users to refine what "good," "average," and "poor" scores actually mean in context
- Tighter algorithm refinement for the peak, stability, and consistency metrics that feed the score
- Input from people with respiratory medicine backgrounds to sanity-check whether the scoring logic reflects anything clinically meaningful, even informally
- Possibly migrating the perf board prototype into a proper PCB, since the layout was already planned with that conversion in mind
Conclusion:
This project started with a simple idea — to make something invisible, visible. Breathing and lung performance are things we experience every day, but we rarely get a clear way to understand what is actually happening inside our body.
By combining a flow sensor, heart rate and oxygen sensor, an ESP32, and a custom web dashboard, this system turns breathing into something you can see, track, and compare. The device gives quick feedback through the on-board score display, while the web interface provides deeper insight through live graphs and real-time vital readings.
More than just a technical build, this project focuses on awareness. It encourages people to think about their breathing habits, the impact of their environment, and how their body responds under different conditions — especially in places where air quality is a serious concern.
At the same time, making the system truly accurate and reliable would require a lot more data, careful calibration, and professional medical guidance. There is still a long way to go in refining the algorithms and improving the quality of the measurements, and this project represents an early step toward that direction.
This is not a medical device, but it is a powerful educational tool. And most importantly, it shows how simple electronics and thoughtful design can turn everyday processes into something meaningful and understandable.